The Conference
Addressing Social Inequalities in the Global North and South On behalf of the Organising Committee, it is an honour to welcome you to the RC28 Spring Meeting 2026. This academic meeting is proposed a...
Next RC28 Spring Meeting will be 20-22 May in Seville.
Submissions until 10 Dec here: eventos.upo.es/137585/detai...
If you're wondering if this is your conference, have a look at what we publish in our journal Research in Social Stratification and Mobility: www.sciencedirect.com/journal/rese...
03.10.2025 11:55 — 👍 21 🔁 15 💬 2 📌 1

Lab Study in Berlin/Madrid on School Meritocracy:
Effort🔨(🧠objective cognitive effort / 👩🏫teacher-perceived effort) → + grades & inequality. Net of IQ, High-SES👨🎓 + effort & GPA returns when lazy. Low-SES👨🎓 - effort; + GPA returns if hardworking. WP👇 Effort-Project econpapers.repec.org/RePEc:fir:ec...
03.10.2025 09:09 — 👍 13 🔁 7 💬 1 📌 0

🚨 New paper: Who climbs the Ivory Tower? 🏛️ Together with Nicolai Borgen and Astrid Sandsør (@astridsandsor.bsky.social), we find that the chances of becoming a professor differ enormously by family background. Here’s what we find 👇
journals.sagepub.com/doi/full/10....
02.10.2025 19:58 — 👍 79 🔁 34 💬 3 📌 3

Paper by Cozzani et al. explores a possible mechanism underlying ART birth disparities & highlights that these disparities do not appear to arise from treatment success, at least when treatments are performed in widely subsidized public context in Italy. www.demographic-research.org/articles/vol...
02.10.2025 06:11 — 👍 17 🔁 7 💬 0 📌 0

Elucidating some common biases in randomized controlled trials
using directed acyclic graphs
Although the ideal randomized clinical trial is the gold standard for causal inference, real randomized trials often suffer
from imperfections that may hamper causal effect estimation. Stating the estimand of interest can help reduce confusion
about what is being estimated, but it is often difficult to determine what is and is not identifiable given a trial’s specific
imperfections. We demonstrate how directed acyclic graphs can be used to elucidate the consequences of common imperfections,
such as noncompliance, unblinding, and drop-out, for the identification of the intention-to-treat effect, the total
treatment effect and the physiological treatment effect. We assert that the physiological treatment effect is not identifiable
outside a trial with perfect compliance and no dropout, where blinding is perfectly maintained

Table 1 showing the Identifiability of target estimands depending on whether there is blinding, full compliance, and no drop-out

An example DAG from the paper.
Fig. 4: A blinded trial with noncompliance.
U are unobserved confounders, Z is treatment assignment, C is compliance, X is the realized treatment, S is the subject's physical and mental health status, Xself and Xcln are the treatment that the participant and the clinician believed the participant received, Y is the outcome.
Just finished reading this *excellent* article by Gabriel et al. which discusses which effects can be identified in randomized controlled trials. With DAGs!>
link.springer.com/article/10.1...
02.10.2025 08:09 — 👍 115 🔁 23 💬 4 📌 1

Studying a survey of Danish mothers' pre-birth beliefs about how their career will unfold finds they accurately anticipate their eventual return to work but underestimate the duration of the career interruption, from Andrew Caplin, Søren Leth-Petersen, and Chris... https://www.nber.org/papers/w34289
30.09.2025 15:30 — 👍 7 🔁 3 💬 0 📌 0
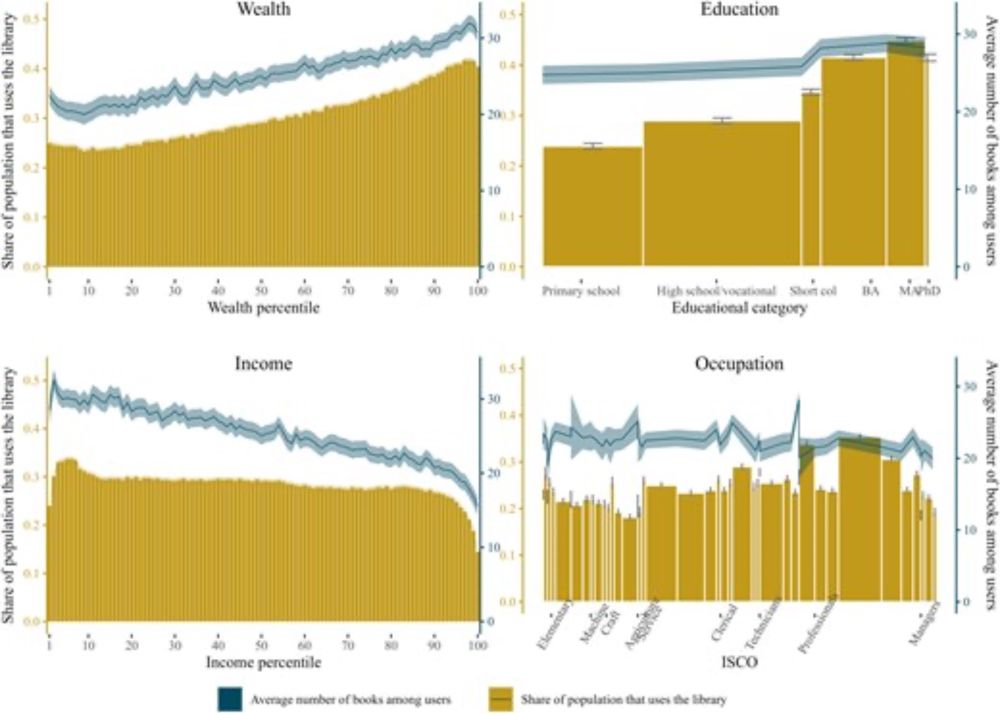
How are cultural tastes stratified? Evidence from library borrowing for the entire population of Denmark
Abstract. Research shows that cultural tastes are socially stratified. Yet, most of this research relies on small-sample surveys and includes only a few di
➡️New paper out with amazing data: library borrowings of the entire population of Denmark!
If cultural tastes are always stratified, the type of stratification depends on the wider inequalities within a context
#EH_Blaabæk #S_Friedman #MM_Jæger #A_Reeves
academic.oup.com/esr/advance-...
30.09.2025 13:29 — 👍 27 🔁 8 💬 0 📌 0
This is a great paper!
29.09.2025 12:15 — 👍 5 🔁 1 💬 0 📌 0
New paper! Led by the brilliant @blaabaek.bsky.social and based on library borrowing data for the entire 🇩🇰 population. Thread below
29.09.2025 11:48 — 👍 14 🔁 6 💬 0 📌 0
As a side note: We struggled with how to meassure "highbrow" tastes without having to simply pick what we thought of as "fancy"
In the end, we asked librarians and literary critics to rank genres. Personally, I think this is neat to capture taste hierarchies as expressed in the empirical context
29.09.2025 10:57 — 👍 5 🔁 0 💬 0 📌 0
In a time of political polarization, it’s worth asking if
culture can bring people together across social divides?
👉 Crime fiction might be such a place for common ground
Public libraries are for everyone. But if some groups don’t use them, we should consider:
📚Do libraries appeal equally to all?
29.09.2025 10:57 — 👍 6 🔁 0 💬 1 📌 0
@madsjaeger.bsky.social @samfriedman.bsky.social @aaronreeves.bsky.social
👩🎓 People with higher education & wealth use libraries much more
💼 Differences across income and occupations are smaller
🕵️♀️ Everyone loves crime novels!
🎨 But the highly educated & wealthy are also drawn to “highbrow” genres
29.09.2025 10:57 — 👍 4 🔁 1 💬 1 📌 0

How are cultural tastes stratified? Evidence from library borrowing for the entire population of Denmark
Abstract. Research shows that cultural tastes are socially stratified. Yet, most of this research relies on small-sample surveys and includes only a few di
Even in Denmark, cultural tastes are socially stratified. With some quite cool library data we find strong gradients by education and wealth - important as wealth is rarely studied in cultural stratification research
doi.org/10.1093/esr/...
OA: osf.io/ar2xc_v2/dow...
@europeansocreview.bsky.social
29.09.2025 10:57 — 👍 135 🔁 38 💬 4 📌 3

Research on fertility and families enhanced with new harmonised cohort data | CLS
Harmonised data on the fertility histories of four British cohorts are now available for the scientific community to download from the UK Data Service.
NEW DATA! Harmonised fertility histories of four British cohorts – born in 1946, 1958, 1970 and 1989-90 – are now available for the scientific community to download from the @ukdataservice.bsky.social
Find out more on the CLS website – bit.ly/42CN0qr
29.09.2025 09:13 — 👍 11 🔁 6 💬 0 📌 1
How Are Cultural Tastes Stratified? Evidence from Library Borrowing for the Entire Population of Denmark Research shows that cultural tastes are socially stratified. Yet, most of this research relies on small-sample surveys and includes only a few dimensions of stratification. To
#sociology link
26.09.2025 12:52 — 👍 1 🔁 1 💬 0 📌 0
More evidence, on top of Baby's First Years experiment, that cash alone in early childhood does not improve children's early developmental trajectory.
In contrast, there is strong evidence that policies that improve children's care experiences do improve their early development & adult outcomes.
24.09.2025 11:44 — 👍 23 🔁 4 💬 2 📌 0
1 year left of my @erc.europa.eu grant on siblings and social mobility! It has been a blast. Below some of the reserach conducted by the outstanding postdocs
Jung In, JMF, onlinelibrary.wiley.com/doi/10.1111/...
Jesper Birkelund, BJS, onlinelibrary.wiley.com/doi/10.1111/...
1/2
#sociology
18.09.2025 18:18 — 👍 22 🔁 4 💬 1 📌 0

We invest 9X less per child-year in care & education in the first 5 years of life than the next 13.
This gap in public investment is why K12 is free for parents & early care & education is expensive.
www.hamiltonproject.org/publication/...
12.03.2025 01:29 — 👍 57 🔁 33 💬 1 📌 6


Unionized careers boost up wealth. Very interesting article by Purdue's Alec Rhodes:
academic.oup.com/sf/advance-a....
05.09.2025 16:24 — 👍 22 🔁 6 💬 1 📌 1
NEW: Samuel Coavoux, Abel Aussant, "Streaming Platforms, Filter Bubbles, and Cultural Inequalities. How Online Services Increase Consumption Diversity" sociologicalscience.com/streaming-pl...
04.09.2025 16:31 — 👍 10 🔁 4 💬 0 📌 1

Self-care is overrated—helping others has the biggest benefits for everyone involved
A new 2-week intervention finds that helping others improves well-being more than "self-kindness", with benefits for depressed mood, anxiety, and loneliness due to social connection psycnet.apa.org/record/2026-...
03.09.2025 14:23 — 👍 336 🔁 122 💬 24 📌 31

Models as Prediction Machines: How to Convert Confusing Coefficients into Clear Quantities
Abstract
Psychological researchers usually make sense of regression models by interpreting coefficient estimates directly. This works well enough for simple linear models, but is more challenging for more complex models with, for example, categorical variables, interactions, non-linearities, and hierarchical structures. Here, we introduce an alternative approach to making sense of statistical models. The central idea is to abstract away from the mechanics of estimation, and to treat models as “counterfactual prediction machines,” which are subsequently queried to estimate quantities and conduct tests that matter substantively. This workflow is model-agnostic; it can be applied in a consistent fashion to draw causal or descriptive inference from a wide range of models. We illustrate how to implement this workflow with the marginaleffects package, which supports over 100 different classes of models in R and Python, and present two worked examples. These examples show how the workflow can be applied across designs (e.g., observational study, randomized experiment) to answer different research questions (e.g., associations, causal effects, effect heterogeneity) while facing various challenges (e.g., controlling for confounders in a flexible manner, modelling ordinal outcomes, and interpreting non-linear models).

Figure illustrating model predictions. On the X-axis the predictor, annual gross income in Euro. On the Y-axis the outcome, predicted life satisfaction. A solid line marks the curve of predictions on which individual data points are marked as model-implied outcomes at incomes of interest. Comparing two such predictions gives us a comparison. We can also fit a tangent to the line of predictions, which illustrates the slope at any given point of the curve.

A figure illustrating various ways to include age as a predictor in a model. On the x-axis age (predictor), on the y-axis the outcome (model-implied importance of friends, including confidence intervals).
Illustrated are
1. age as a categorical predictor, resultings in the predictions bouncing around a lot with wide confidence intervals
2. age as a linear predictor, which forces a straight line through the data points that has a very tight confidence band and
3. age splines, which lies somewhere in between as it smoothly follows the data but has more uncertainty than the straight line.
Ever stared at a table of regression coefficients & wondered what you're doing with your life?
Very excited to share this gentle introduction to another way of making sense of statistical models (w @vincentab.bsky.social)
Preprint: doi.org/10.31234/osf...
Website: j-rohrer.github.io/marginal-psy...
25.08.2025 11:49 — 👍 942 🔁 283 💬 49 📌 19

Good to see growing support for abduction or 'inference to the best explanation', recently by Spirling and Stewart in @thejop.bsky.social. This is...
www.journals.uchicago.edu/doi/full/10....
21.08.2025 19:35 — 👍 91 🔁 20 💬 7 📌 3
Political scientist at University of Oxford. Voting, elections, discrimination, conjoint/field experiments, in-group voting, immigration attitudes, politics, representation. https://www.compas.ox.ac.uk/people/sanne-van-oosten/
Postdoc in Sociology at Utrecht University; PhD from @EUI_EU
Polarization | Cleavages | Social Networks | Political Sociology www.jonadejong.com
PhD candidate at European Research Center for Migration and Ethnic Relations (ERCOMER) - Utrecht University
Research interests 📖: social cohesion, voting behavior, QuantCrit, survey experiments
PhD student at University of Amsterdam | European identities 🇪🇺
Assistant Professor in Sociology @Radboud_Uni | Studying in- & exclusion processes of migrants with a mix of methods 📊🎙️ | In de redactie van Mens & Maatschappij
PhD Candidate in Political Sociology researching stereotypes, perceptions, trust, and attitudes.
I am passionate about political communication and stand-up comedy, which are often the same thing.
Research Associate | The German Institute for Economic Research (@diw.de)
Affiliated to the Faculty of Sociology, Universität Bielefeld
Open Science enthusiast
Sociologist of Education, Internationalisation & Cosmopolitan Capital / Senior Researcher at the Swiss Elites Observatory (OBELIS) University of Lausanne / Member of the World Elite Database / Asian Descent Feminist in Europe
Professor of political economy & public policy, Dep. Politics; Chair, Danish Institute for Advanced Study, SDU. Political demography, aging democracies & welfare states, intergenerational fairness https://portal.findresearcher.sdu.dk/en/persons/vanhuysse
Associate Professor of Political Science, Aarhus University
I study political elites, institutions, and public opinion in Europe, using experiments and computational methods.
https://romansenninger.github.io/
Associate Professor of Political Science, Aalborg University 🇩🇰
EU | Comparative Political Behavior | Inequality | Democratic Trust & Legitimacy
www.dominikschraff.com
www.eu-ned.com
Sociology PhD candidate at Cornell, studying wealth inequality and elites.
person, love musicals, wing chun, and stats. 🏳️🌈
I study inequality in education, work, and health. MSCA fellow at INVEST, Uni Turku. Previously PhD at INED and CRIS (Sciences Po), lecturer ENS, and M.A at Uni Trento. martafacchini.github.io
Quantitative Sociologist at the University of Kent.
Author: Critical Statistics - Seeing Beyond the Headlines (https://www.bloomsbury.com/uk/critical-statistics-9781137609793/)
Professor of Cultural and Creative Industries, University of Manchester and host of New Books in Critical Theory. Currently on secondment to DCMS, also at Creative PEC and the Whats On Project too
Lecturer (Assistant Professor) in Education at the University of Glasgow. Parent engagement, immigration and education, Pierre Bourdieu.
Postdoc LIVES Centre, University of Lausanne.
https://aliciagarciasierra.github.io/
Political scientist at Johns Hopkins University: democracy, inequality, political psychology, public opinion, behavioral everything. No relation. American by way of Estonia, Sweden, and England.
PhD student at the Department of Political Science at Stockholm University. Interested in political attitudes and behaviors. I enjoy working with #rstats.
website: https://joenoonan.se/