The latest version of the {mapgl} #rstats package is now released, supporting scrollytelling-style story maps!
Build richly interactive map stories from your R data pipelines using @Mapbox or @maplibre as your backend.
Learn how in the new vignette: walker-data.com/mapg...
14.01.2025 14:46 — 👍 39 🔁 7 💬 3 📌 2
Is there a link between #ClimateChange & increasing risk/severity of #wildfire in California--including the still-unfolding disaster? Yes. Is climate change the only factor at play? No, of course not. So what's really going on? [Thread] #CAfire #CAwx #LAfires iopscience.iop.org/a...
09.01.2025 22:05 — 👍 790 🔁 366 💬 26 📌 73

Chart showing Fire Weather Index data over past couple years in LA area.
There is no end to wildfire season in places like LA anymore.
I just pulled the latest Fire Weather Index Data and what's striking is risky conditions have not let up in Dec, Jan as they usually do.
Extreme dryness is overlapping with high wind speeds which are literally ~fanning the flames~.
08.01.2025 16:49 — 👍 63 🔁 22 💬 3 📌 1

Cheat sheet showing challenges and design solutions for responsive maps. Too small to read everything in the preview, but the full, accessible version is available at the link in the post.
Excited to share some work I'll be presenting at @ieeevis.bsky.social 📊 I developed a cheat sheet of strategies for responsive thematic mapping based on interviews & design workshops with visualization/mapping practitioners. Find the cheat sheet here: responsive-vis.github.io/map-cheat-sh...
03.09.2024 18:24 — 👍 37 🔁 12 💬 1 📌 1
CalFires's 3D map let's you jump between active incidents:
www.fire.ca.gov/incidents.html
Their opening dashboard has more information about each of the incidents:
www.fire.ca.gov/incidents
08.01.2025 13:57 — 👍 0 🔁 1 💬 0 📌 0
The figures in this are some of the most well thought out I've seen in a paper in ages. It very clearly lays out the effects of fire severity on aquatic organisms and how that relationship shifts over time. Wowza!
07.01.2025 17:55 — 👍 3 🔁 1 💬 0 📌 0
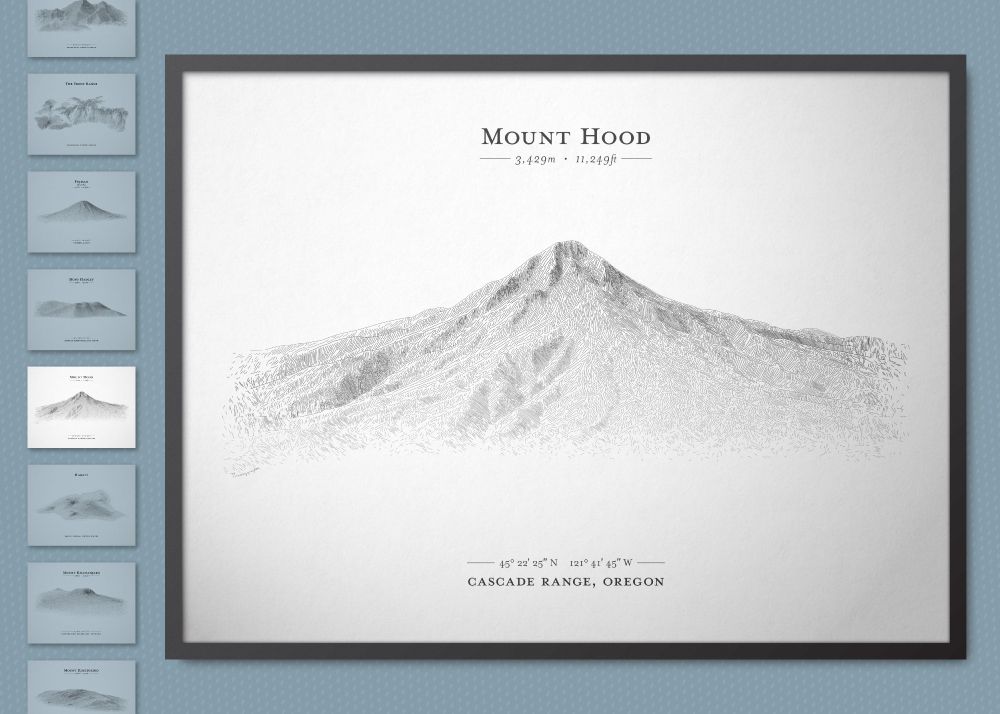
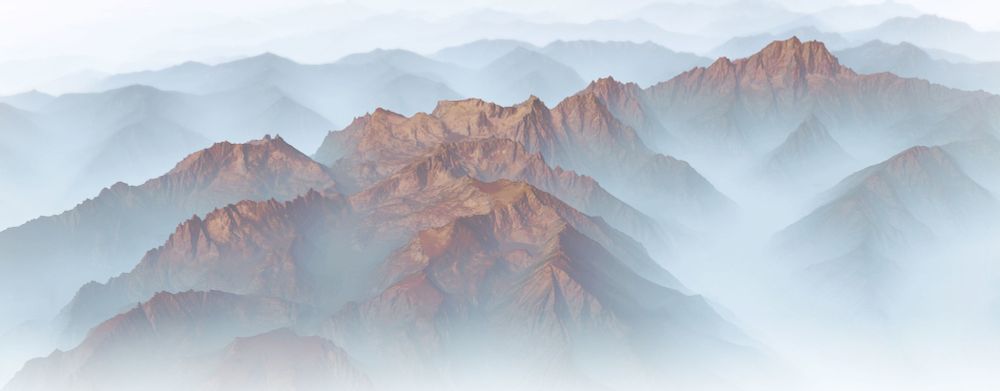
A black and white sketch of Mount Hood, seen from a roughly ground level view. It is in a black frame, and on a blue background. Off to the left are a vertically stacked series of smaller images, too small to read. Each is different-looking, but all are black and white miniature versions of posters. The miniature version of the Mount Hood poster is highlighted in white.

Sample images of three monochrome posters each prepared in a line drawing style. One shows Mount Rainier, another Katahdin, and the last one shows Devil's tower. The posters are stacked on top of each other and the Mount Rainier one is partially rolled up.

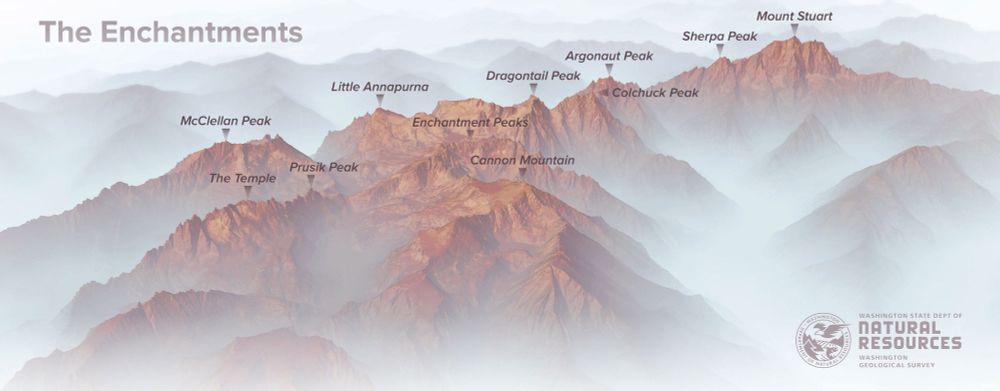
A detailed zoom in of a hachured representation of the Presidential Range, with peaks labeled.

A vertical-orientation poster titled "The Seven Summits" — it shows black and white sketches of seven different peaks, the highest on each continent. The peak sketches alternate between being positioned on the left and the right side of the poster. Next to each is a label naming the mountain and giving its location. The poster is framed on a blue background.
I arrive here having finished a major, multi-month project: creating a posters in a hachure style reminiscent of centuries past. Have a look: terrainlines.etsy.com.
There's a free ebook, too! somethingaboutmaps.wordpress.com/2024/10/31/a...
If you could share them around, I would be grateful!
11.11.2024 18:47 — 👍 140 🔁 29 💬 5 📌 5

Funding & awards
A list of conservation-related scholarships, fellowships, funding, and awards.
Happy New Year!
I updated my webpage of envirionment-related scholarships, grants, & awards: www.aerinjacob.ca/funding--awa...
It includes:
* science
* action & policy
* communication
* travel awards
* international tho' emphasis on N Am, Africa, & women
Please share.
#ConservationFunding
03.01.2025 23:00 — 👍 138 🔁 97 💬 9 📌 6
Congrats Weiwei (and et. al)! This will for sure be a hugely impactful paper. I know I've been curious about changes in fire severity and am glad to have a paper to point to going forward.
Also, this is a baller figure— way to summarize a lot of information in an attractive and succinct format. 🙌
03.01.2025 18:37 — 👍 1 🔁 0 💬 0 📌 0

Learning Fire with Charity Battise-YourForest
We’re Back! Good Fire Season 3 is officially coming your way! This is a short teaser episode to let you all know we have finally finished recording. Charity Battise is a young Indigenous Fire Steward...
Good Fire S3 is coming 🥳! I can't wait.
This teaser explores burning longleaf pine on the lands of the Alabama-Coushatta Tribe of Texas and highlights the cultural significance and fire stewardship of longleaf.
Great episode @amycardinal.bsky.social!
yourforestpodcast.com/good-fire-po...
03.01.2025 15:01 — 👍 8 🔁 3 💬 1 📌 0

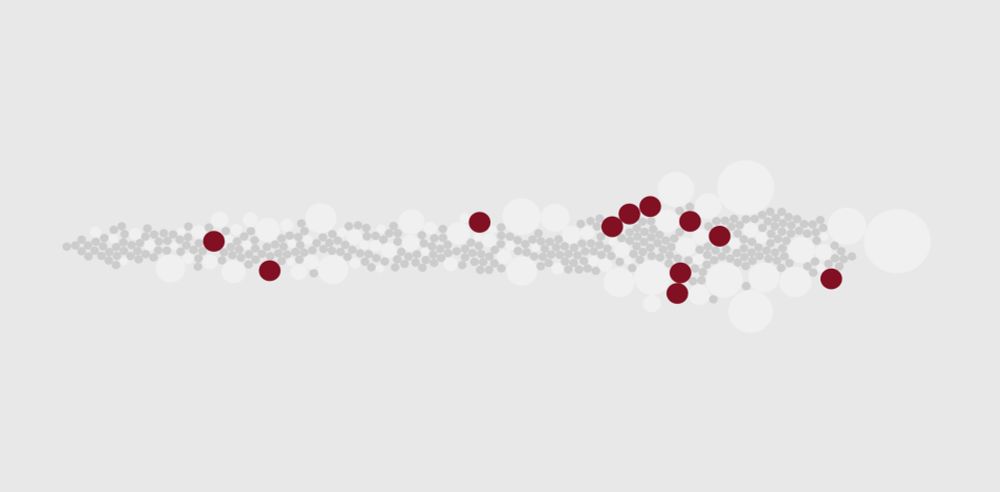
I’m working on updates the Capitol Riot Map—an interactive visualization of the more than 1,500 individuals connected to January 6th.
I’ve spent more than 3-years and devoted hundreds of hours to this project, and there’s still more work to be done. Details on how to support this project below👇🏼
02.01.2025 19:10 — 👍 16510 🔁 2880 💬 521 📌 123

🎨✨ R isn’t just for crunching numbers – you can make art with it too! A colleague sent me this, and I had to try it myself 🎆 Fireworks with ggplot2!
Here’s to a creative and data-driven 2025! 🖼️💻
👉 Code here: pastejustit.com/to2jqgsjvd
#RStats #DataArt #HappyNewYear2025
01.01.2025 18:42 — 👍 17 🔁 5 💬 0 📌 0
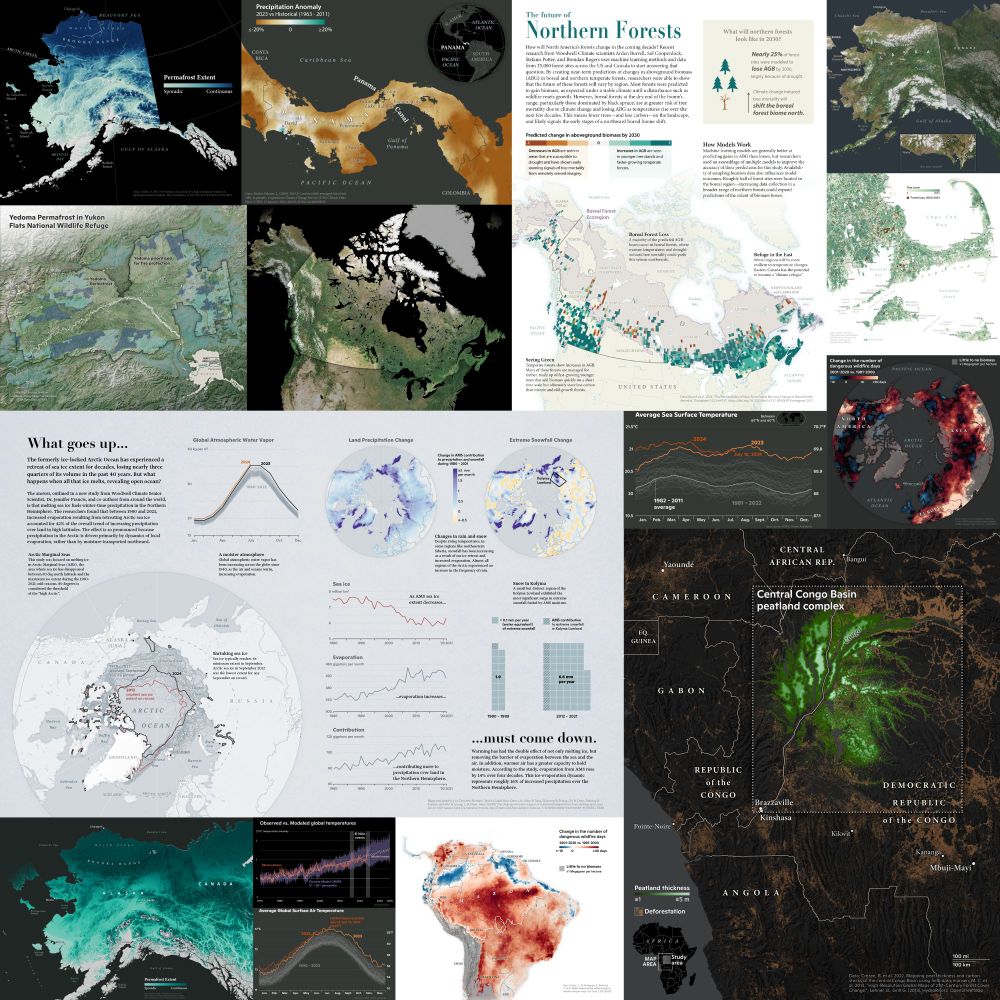
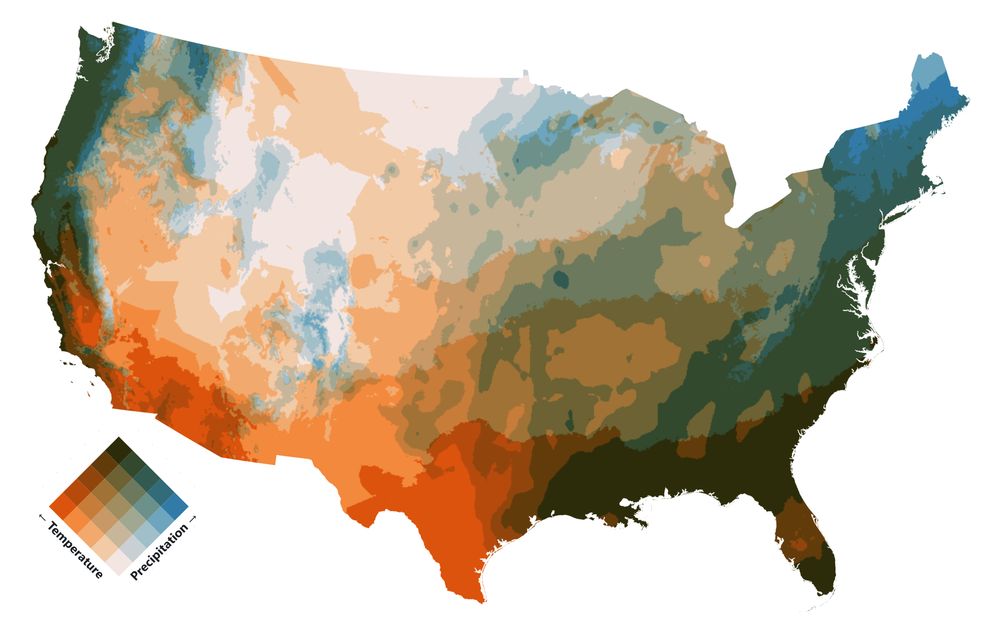
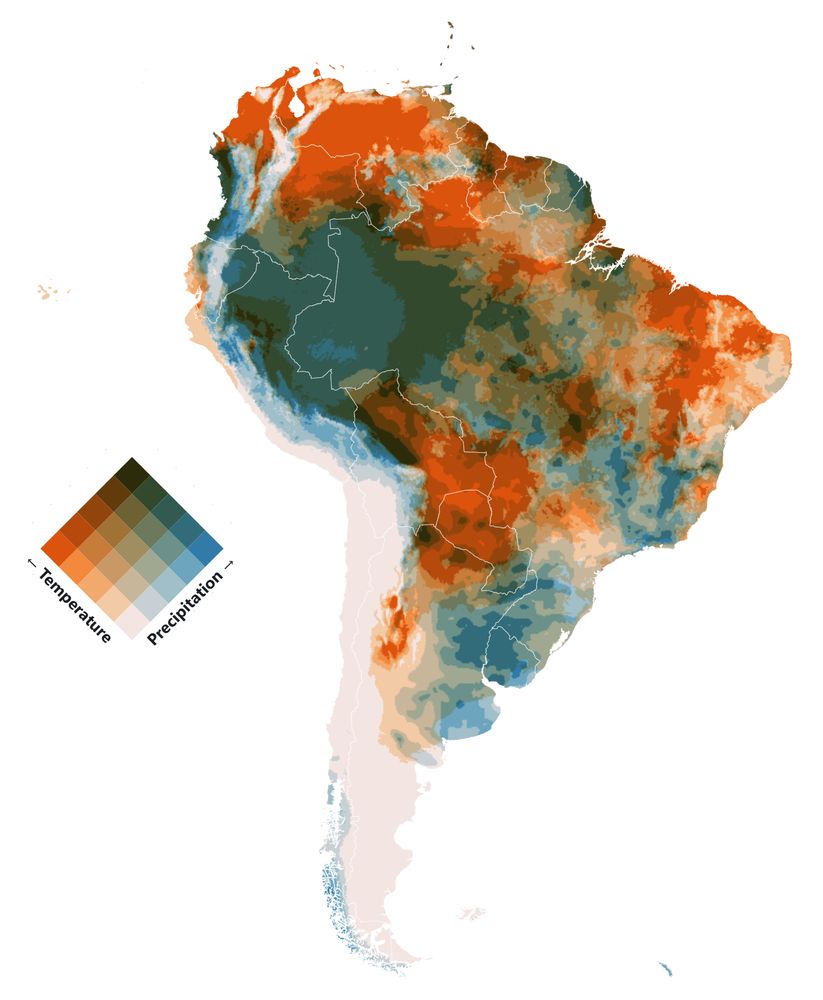
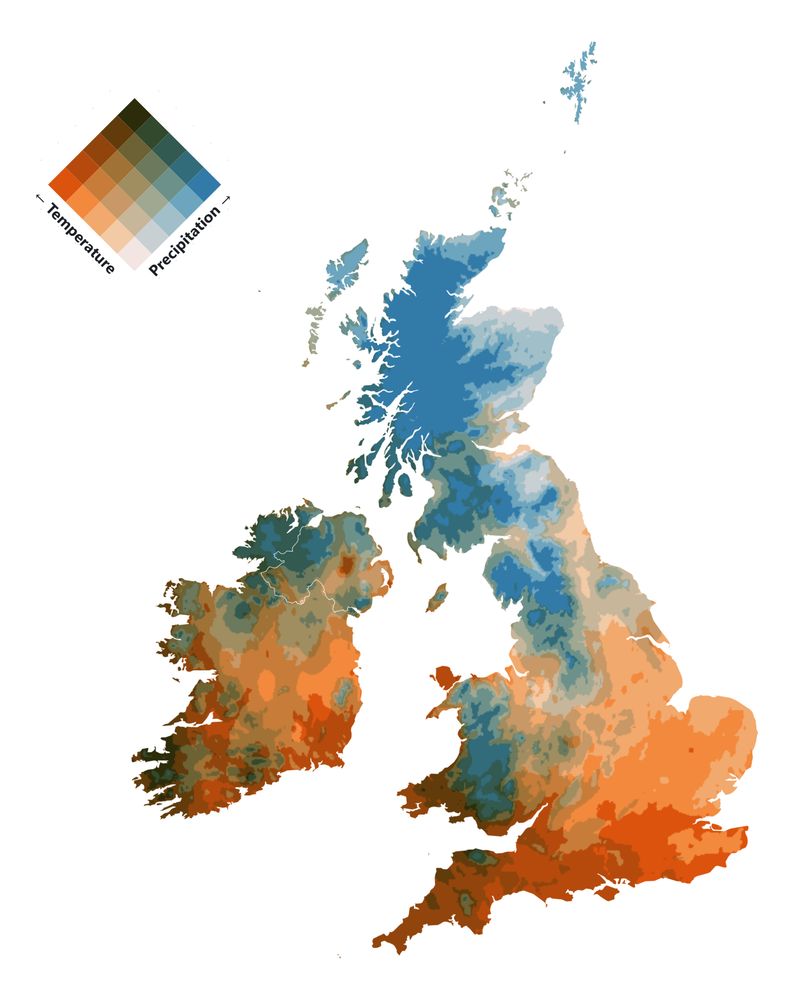
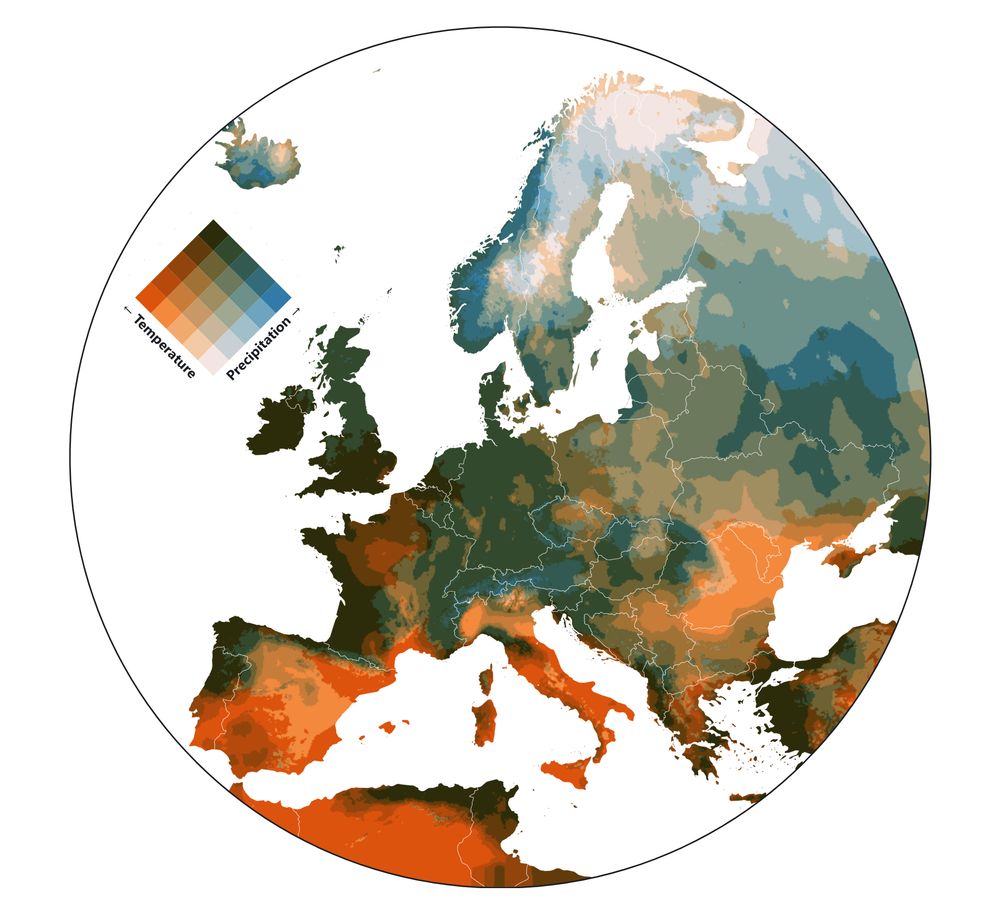
A collage of maps that Christina made in 2024. Topics include permafrost, boreal forests, wildfire, peatlands, and drought.
A few of the maps and graphics I made in 2024. What climate maps do you want to see next year?
31.12.2024 18:45 — 👍 102 🔁 22 💬 9 📌 1
I see myself in this picture, and I don't like it
01.01.2025 21:02 — 👍 0 🔁 0 💬 0 📌 0
I was (not so secretly) hoping someone in the #Rstats community would have a solution they could pass my way 🫶.
Thanks so much for the tip, AND for having such a nicely organized code repo for folks like myself to snoop in and use to improve!
31.12.2024 22:41 — 👍 4 🔁 0 💬 0 📌 0
Things I learned from my first #TidyTuesday
🖼️ images can be a PAIN
👀 sneak peeks at others' Git repos are invaluable (ty @karaman.is & @nrennie.bsky.social for font and colour ideas)
🤏 scaling from R's plot pane to final product is high on my learning list (guess and check is no fun)
#Rstats
31.12.2024 18:08 — 👍 9 🔁 0 💬 1 📌 0

A barchart showing the top 10 cities winning individual chef awards, with colors for each award
My first #TidyTuesday! Where to find the top chefs in the US?
For a simple graphic, I was surprised at how much time I sunk into this. I fought too long with different ways to load the award image. But, learned lots
Code: coming soon, using this to finally setup a GitHub workflow
#Rstats #dataviz
31.12.2024 17:54 — 👍 15 🔁 0 💬 0 📌 0

#TidyTuesday Roundup 2024.💖
Code: github.com/deepdk/TidyT...
#dataviz #rstats
31.12.2024 13:34 — 👍 35 🔁 5 💬 1 📌 0
This starter pack was invaluable for finding my people. Thanks for creating it—my feed is finally starting to look like it did on the bird site!
(Also, hello to everyone I just followed. I'm already eating up your gorgeous maps 🗺️)
30.12.2024 18:57 — 👍 3 🔁 1 💬 0 📌 0
Love posts like this that give me fun new font ideas 😍
30.12.2024 18:04 — 👍 0 🔁 0 💬 0 📌 0
Wildfire analyst @ Canadian Forest Service here, specializing in #fireecology and long-term fire risk. Passionate about turning complex data into visuals that spark curiosity. Let's connect if you're into #firescience, #dataviz, or just love a good map! Bonus points if you bring marshmellows.
27.12.2024 15:45 — 👍 2 🔁 0 💬 1 📌 0
Nature lover, science nerd, book geek (sci-fi, dystopian, feminist), Democrat all the way. Gen Joneser, still love 70's rock. SF Bay Area "almost" native, haven't given up on CA yet.
Director, UC Merced Fire Resilience Center. Pyrogeographer. I study wildfire in the era of anthropogenic climate change. Former wildland firefighter. Opinions are my own. *she/her* 🔥🔥🔥
Yes it's me from twitter and @bigbookofr.com!
#dataBS #RStats
#rstats | #energy | #climate | #carbonmanagement | #sustainability | #ESG
https://shelkariuki.netlify.app
Freelance Data Visualization Specialist and Data Analyst. 📊 Book nerd📚. Always seeking new insights and knowledge💡Available for Projects.
https://deepalikank.in/
Data visualization designer
krisztinaszucs.com
Professor Emeritus of geography & environmental studies, Saint Mary's University, Canada.
Interested in mapping, urban planning, transportation, time use, Nova Scotia
#geography #location #maps #transportation #urban
Associate Professor @UTKnoxville | Amazon Scholar | Creator of #geemap & #leafmap | Talk about #Geospatial #GeoPython #DataViz #GIS #FOSS #EarthEngine
Researcher. Cities, urban morphology, human geography & spatial data science. Open source software developer. #python #cities #open_science
https://martinfleischmann.net
#Urbanismo, Política y Filosofía | Maestría en Planificación y Políticas Urbanas.
https://substack.com/@fernandomaidana
(Mis opiniones son personales)
Forest Fire Research Scientist with Canadian Forest Service 🔥🌲🌳 and the WildFireSat mission 🚀🛰 📡 | Advancing how we use satellites to monitor fires and their impacts | Woman in Remote Sensing | Mother in Science 💻👩💻👩🔬🧪 | she/hers | celiac | 📚🎵🎶👟☕️ | 🇨🇦🇺🇸
Research Faculty at Michigan State University. Geodesy, Tectonics, and Glaciers. All opinions my own.
Collaborative Innovation @IGNFrance.bsky.social 🇫🇷 | Chair of Commission 4 @EuroSDR 🇪🇺 | 🌍🗺️🛰️ #Innovation #OpenData #DataValuation #Commons | ♀️=♂️
data scientist in toronto / maps and dataviz / almost useless trivia knowledge
https://ivabrunec.github.io/
#LFC fan, from Plymouth, lives in Corfe Mullen Dorset, husband, father, grandad, brother, son.
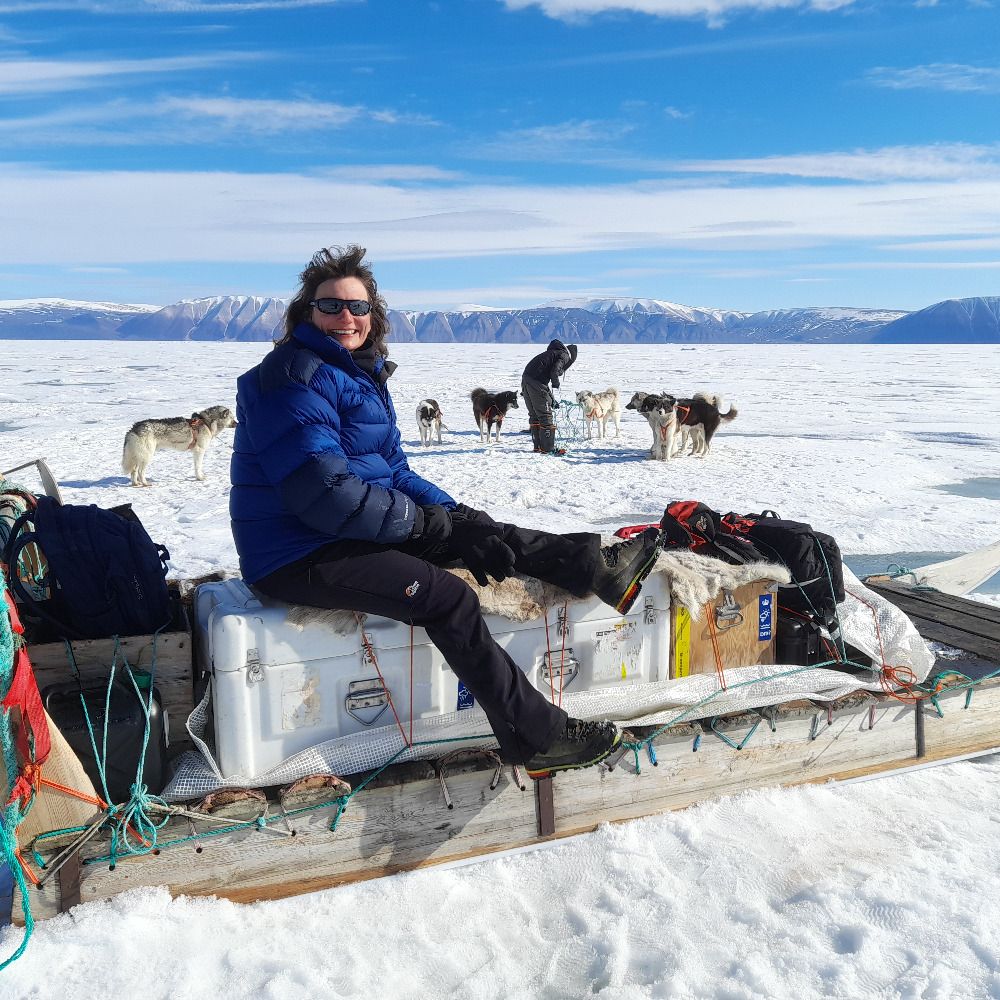
Climate scientist at DMI, Greenland, Antarctica, polar regions in general.
Dipping a toe in yet another social media site. Mostly on mastodon though @ruth_mottram@fediscience.org
Blogging at sternaparadisaea.net
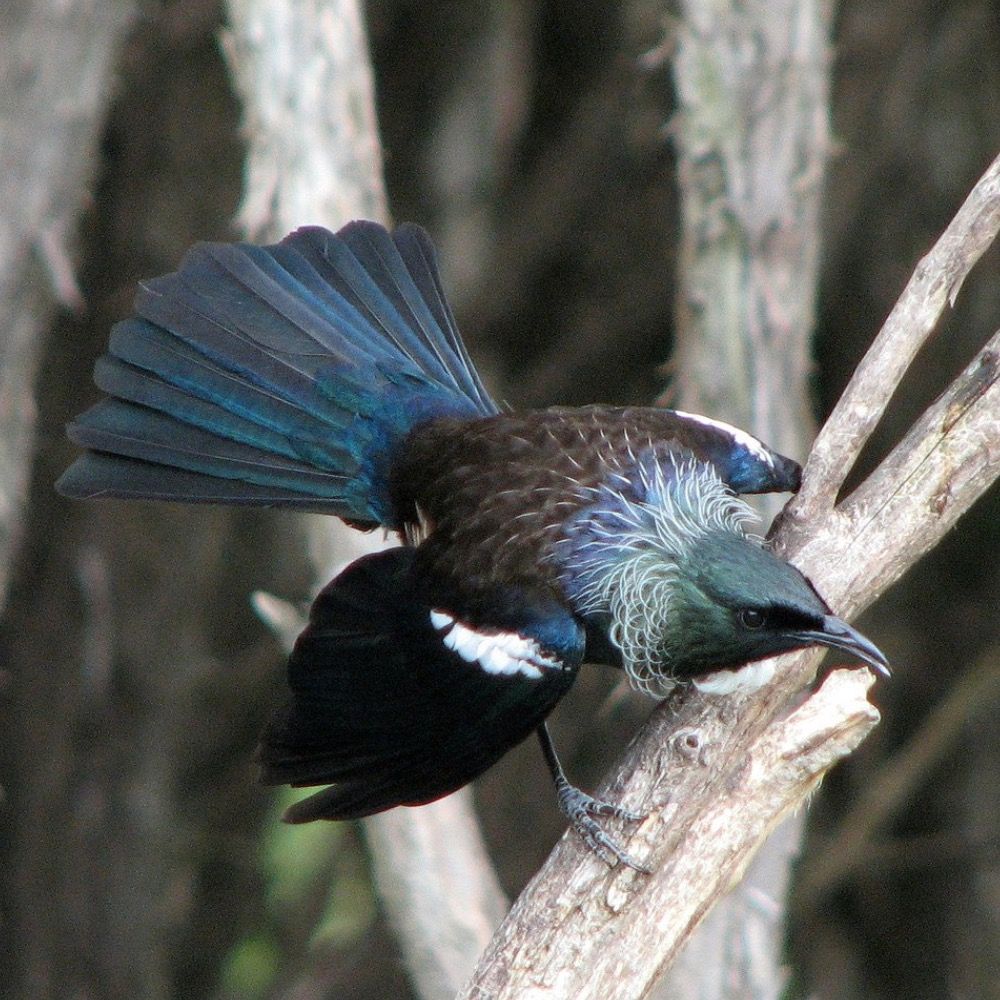
I like collating data,
and getting thoughts in the brain.
All for Public data, Aotearoa New Zealand, and informed communities. #openData #NewZealand #Aotearoa #rstats. He/him.
He tangata tiriti ahau
Pro Genealogist & Scientist at www.khronicle.co.uk, #Genealogy Expert for Time Team. Oxford D.Phil.(SysBio), Fiend for #maps & #research methods. Big hair, big heels, weakness for cake.She/her.
Blog: www.parchmentrustler.com
Climate Scientist -Earth -Water -Data.
PhD, PG
https://scholar.google.co.uk/citations?hl=en&pli=1&user=aEgv38gAAAAJ