Happy (belated) Valentine's Day from our lab to yours 💕
Image credit: @loggas.bsky.social and Lisa Künstler
@loggas.bsky.social
MD, PhD candidate in Institute of Computational Biomedicine - AG Schapiro, Interested in quantitative tissue analysis 💻 www.github.com/LukasHats
Happy (belated) Valentine's Day from our lab to yours 💕
Image credit: @loggas.bsky.social and Lisa Künstler

🔬🏥 Gesundheitsforschung für die Menschen im InnoLÄND! In der Health + Life Science Alliance Heidelberg Mannheim wird zu zentralen Gesundheitsfragen geforscht. Mit der Innovationscampus-Förderung ermöglichen wir Grundlagenforschung mit Potenzial für biomedizinische Durchbrüche. 🔗 youtu.be/LZN-Sx9wfVQ
24.11.2025 15:55 — 👍 5 🔁 4 💬 0 📌 0
I collected all of what I could find about the upcoming Illumina Spatial Transcriptomics technology, with some predictions about costs and sensitivity compared to 10x Genomics Visium HD
www.batcheffect.com/p/the-giant-...

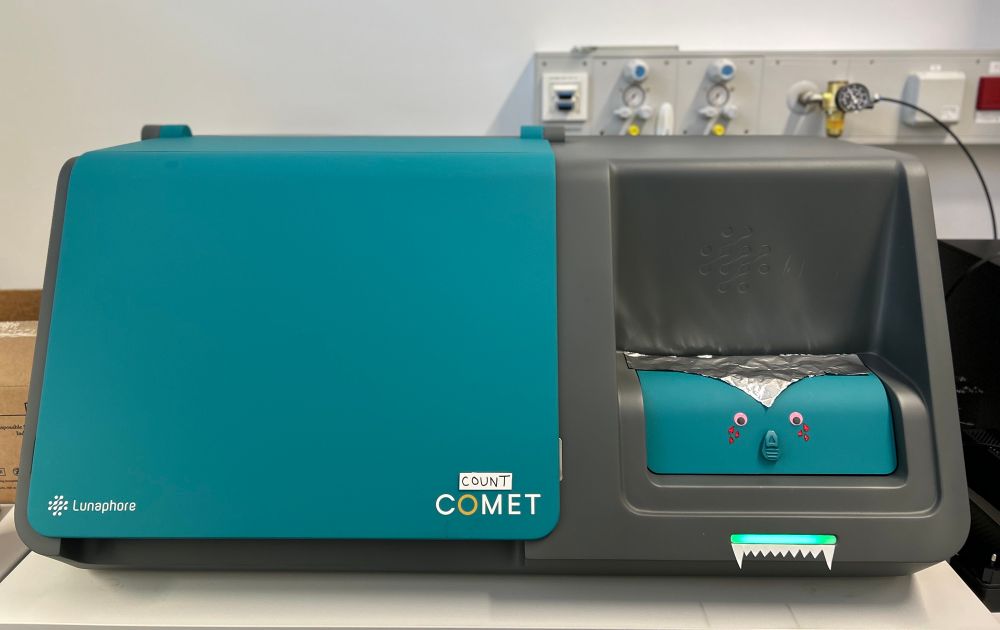
Introducing Count COMET 🧛🧛♀️
Happy Halloween! 🎃
Yes that’s exactly what I meant, I think it’s unique ;)
14.10.2025 15:34 — 👍 1 🔁 0 💬 1 📌 0Entrance of this helix? Or should we meet at your poster?
14.10.2025 15:21 — 👍 0 🔁 0 💬 1 📌 0Sounds good, how about tomorrows coffee break at 10:00?
14.10.2025 13:30 — 👍 1 🔁 0 💬 1 📌 0Would love to hear and talk about muspan and its integration into existing single cell data formats. When are you presenting your poster?
14.10.2025 12:44 — 👍 2 🔁 0 💬 2 📌 0
Our benchmark + guidelines for atlas-level differential gene expression of single cells is online:
academic.oup.com/bib/article/...
Bottom line: Use pseudobulk + DESeq2 in simple and pseudobulk + DREAM in more complex settings.
Collab w/ @leonhafner.bsky.social @itisalist.bsky.social
Well this also depends on how we define the term hallucinations and the output an LLM is generating. I think it’s more terminology problem here. Which does not change the fact that a lot of people do not understand what an LLM is doing and how to proper interpret the outputs.
12.10.2025 16:47 — 👍 1 🔁 0 💬 0 📌 02 decades of self-injecting venom and hundreds of snake bites
18.09.2025 06:48 — 👍 0 🔁 0 💬 0 📌 0
This guy really dedicated his life to science:
www.sciencedirect.com/science/arti...
www.science.org/content/arti...
Thanks Jim!
13.09.2025 19:03 — 👍 1 🔁 0 💬 0 📌 0And last but not least thanks a lot to @denisschapiro.bsky.social who established the collaboration and mentored me.
13.09.2025 08:24 — 👍 1 🔁 0 💬 0 📌 0I am happy to have worked with my collaborators from NTNU (Ingrid and Therese) on this amazing project, as well as @chiaraschiller.bsky.social who developed COZi (www.biorxiv.org/content/10.1...). shout out to CellCharter developer @marcovarrone.bsky.social for his amazing method(and collaboration)
13.09.2025 08:24 — 👍 1 🔁 0 💬 1 📌 0The spatial analysis highlight is that we uncover this signal using 2 different spatial resolutions (cell and neighborhood level) and 2 independent methods (COZI and CellCharter). We hope that this will open up new research paths in Myeloma focusing on these cell interactions.
13.09.2025 08:24 — 👍 0 🔁 0 💬 1 📌 0To our very surprise we find that increased “interaction” of PCs and a variety of immune cells, especially CD4+Tcells, is associated to increased risk of progression, which is contrary to many findings in other tumors where tumor immune interaction seem to generally be beneficial for patients.
13.09.2025 08:24 — 👍 1 🔁 0 💬 1 📌 0Lastly we apply cell neighbor preference analysis with COZI (developed by @chiaraschiller.bsky.social ) and CellCharter’s neighborhood enrichment method and connect these findings to associated clinical metadata:
13.09.2025 08:24 — 👍 0 🔁 0 💬 1 📌 0This questions the common belief that malignant PCs solely rely on glycolytic metabolism for cancer progression and niche establishment.
We further show that the aggregate size of the PC_OXPHOS neighborhood negatively correlates with immune infiltration
This led to the finding of 2 different malignant PC neighborhoods: 1) PC_OXPHOS characterized by huge vascularized aggregates of PCs with increased oxidative phosphorylation and 2)PC_MYELOID, where PCs show glycolytic metabolism and are loosely scattered around including myeloid cells.
13.09.2025 08:24 — 👍 0 🔁 0 💬 1 📌 0As our antibody panel focused on functional markers, we used a novel neighborhood algorithm CellCharter ( @marcovarrone.bsky.social ) to structure the tissue into neighborhoods driven by not only cell types but also functional state.
13.09.2025 08:24 — 👍 1 🔁 0 💬 1 📌 0We show that:
MM patients with bone disease (a frequent comorbidity) show an increased abundance of malignant Plasma Cells (PCs) in the vicinity of Osteoclasts and that PCs display a bone distance dependent expression of factors involved in bone degradation (IL32, HIF1A)
We apply IMC to biopsies from 65 MM patients, 6 SMM and 5 MGUS patients with an antibody panel focusing on immune, bone cells and metabolism. The dataset consists of roughly 1 million labeled cells including distance to the next bone surface for every image (soon on zenodo 10.5281/zenodo.17093203)
13.09.2025 08:24 — 👍 1 🔁 0 💬 1 📌 0
I am excited to share my first work in @schapirolab.bsky.social on Multiple Myeloma (MM) in collaboration with the Standal Lab from NTNU Norway. We use Imaging Mass Cytometry (IMC) on bone marrow biopsies from MM and precursor patients (details below): www.biorxiv.org/content/10.1...
13.09.2025 08:24 — 👍 12 🔁 5 💬 2 📌 2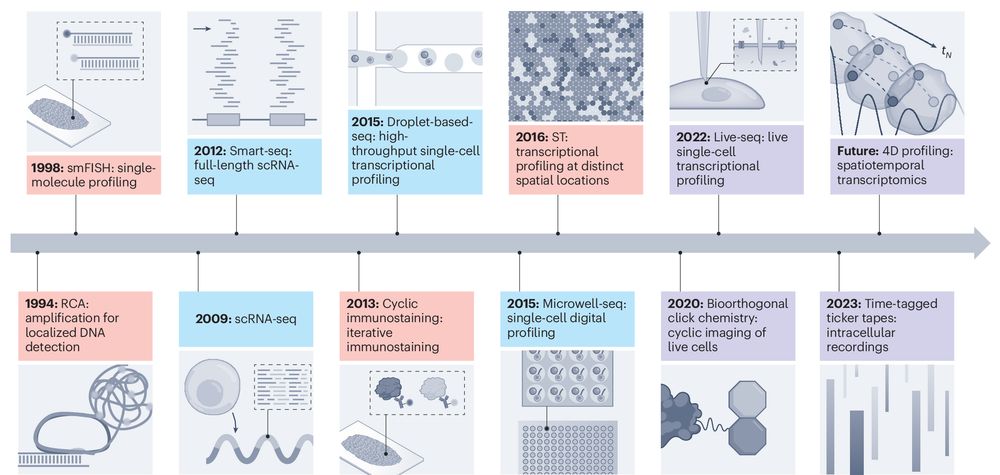
Nature Method: Temporal and spatial omics technologies for 4D profiling
www.nature.com/articles/s4...
Thanks @marcovarrone.bsky.social it was a pleasure, learnt a lot from the way you built your codebase. We have a paper coming up with a lot of cellcharter in there! Amazing method :)
16.07.2025 18:56 — 👍 0 🔁 0 💬 0 📌 0And for anyone who has considered contributing to an open source package: don't be scared to propose changes.
Even if it's not a complete and perfect solution, whoever is maintaining the package will help you in get to the right solution and they will be incredibly grateful.
For people like me who don't have a team behind a package like CellCharter, contributions like these mean a lot. So thank you Lukas :)
And congratulations, it's not always easy to jump into an existing codebase and propose changes.

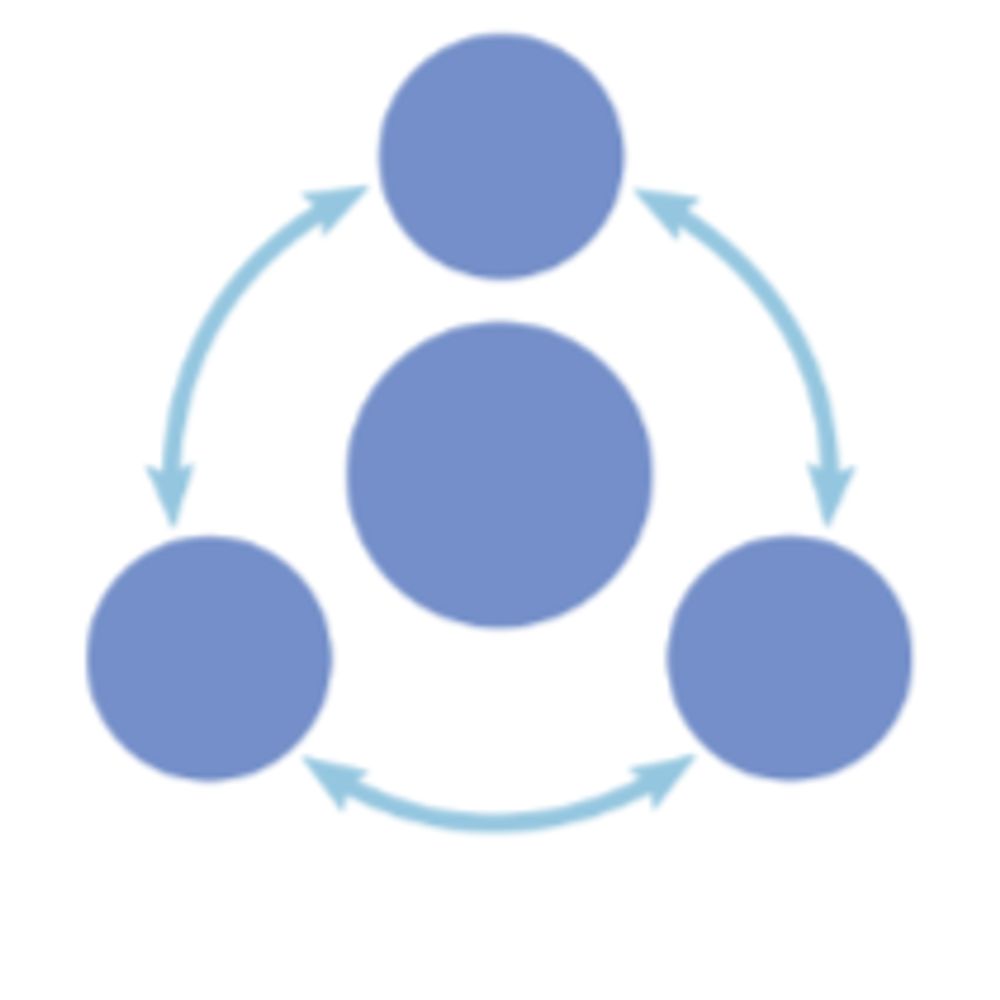
RCS measures how large a cell niche (aka spatial domain aka spatial cluster) is compared to what would be normally expected.
This pushed me to completely rewrite the system for generating and plotting boundaries for cell niches.
The new system is now more efficient, consistent, and visually clear.