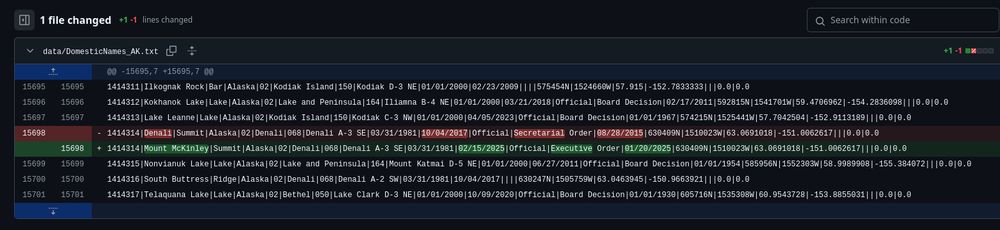
A git diff showing Denali renamed to Mt. Mckinley by executive order
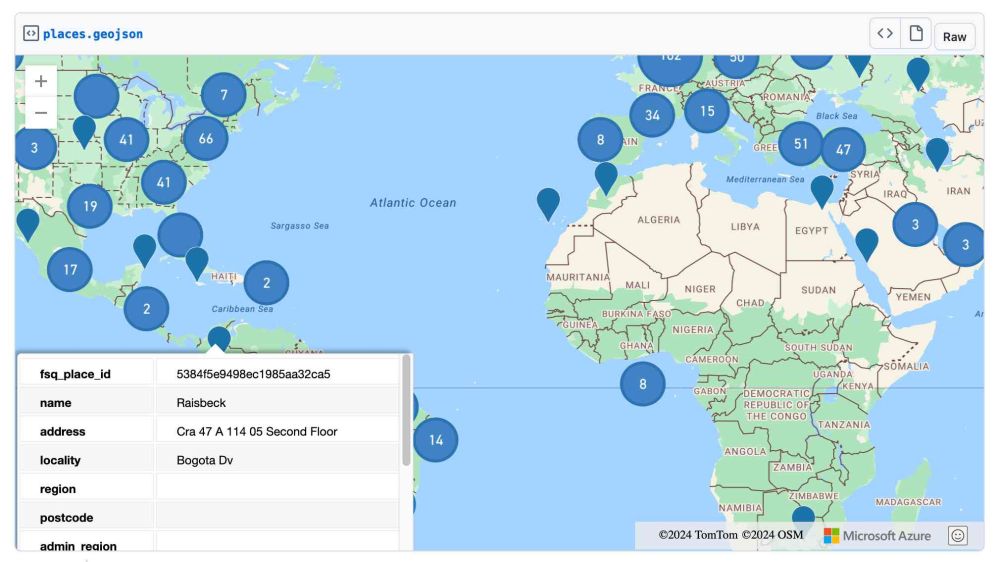
I made a Github repository a few days ago to automatically track changes to the GNIS database of place names in the US.
Apparently it works.
#Denali
21.02.2025 00:28 — 👍 2 🔁 0 💬 1 📌 0
bsky.app/profile/did:...
Nothing fancy at all. Turns out Earth's surface color is pretty predictable.
10.12.2024 02:36 — 👍 1 🔁 0 💬 0 📌 0
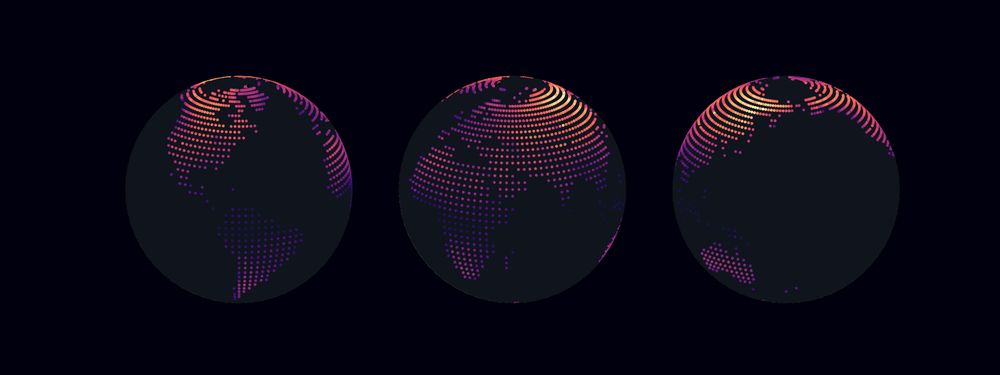
The globe from 3 different angles, showing a dense grid of colored points from dark purple to bright orange, representing annual temperature range.
The model is a stupidly simple pixel-based random forest trained with a grid of sampled points (below) using downscaled bioclimatic predictors derived from temp and precip (via WorldClim) and stretched MODIS RGB.
I also tried predicting in HSV and LAB space, but RGB looked the best 🤷♂️
08.12.2024 20:15 — 👍 6 🔁 0 💬 0 📌 1
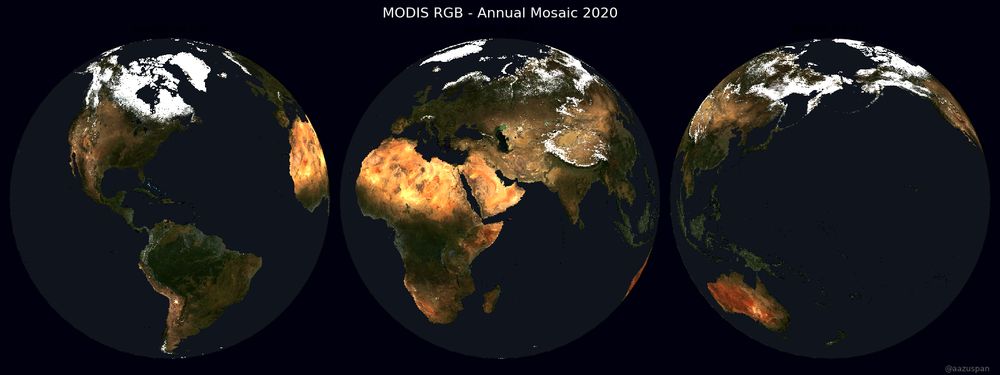
Title: MODIS RGB - Annual Mosaic 2020. Earth from 3 different angles in natural color, using real satellite imagery. It's an annual mosaic, so there's snow and ice around the Arctic circle.
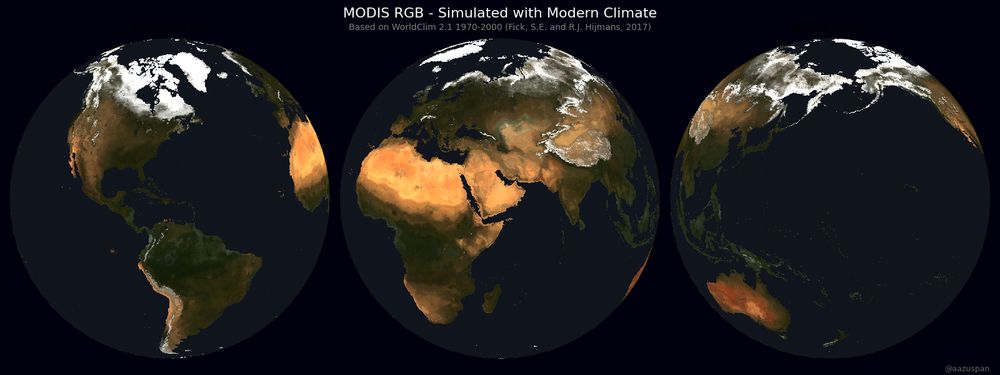
Title: MODIS RGB - Simulated with Modern Climate. Subtitle: Based on WorldClim 2.1 1970-2000 (Fick, S.E. and R.J Hijmans, 2017). Earth from 3 different angles in natural color. Some details are missing, but it looks very much like real satellite imagery of Earth.
For comparison, here's the actual and predicted modern imagery from MODIS. A climate-only model definitely misses some topographic and soil detail, but seems to capture land cover surprisingly well.
08.12.2024 20:15 — 👍 3 🔁 0 💬 2 📌 0
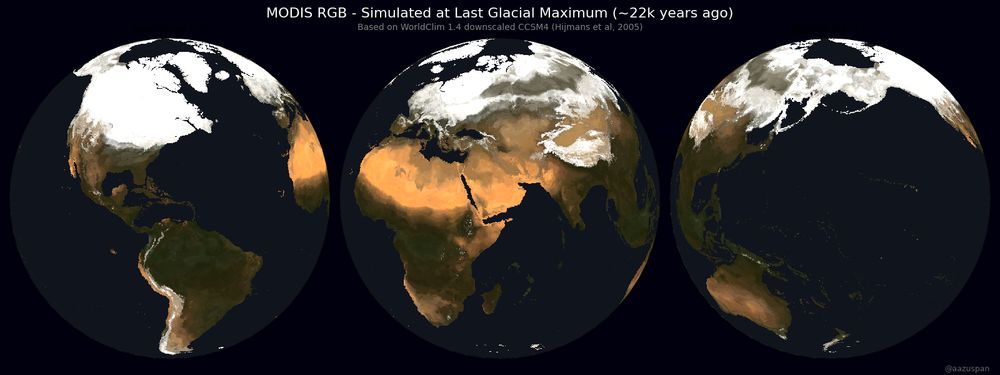
Title: MODIS RGB - Simulated at Last Glacial Maximum (~22k years ago). Subtitle: Basesd on WorldClim 1.4 downscaled CCSM (Hijmans et al, 2005). Earth from 3 different angles in natural color. It looks relatively similar to the modern world, but the northern hemisphere has much more ice and snow. Western Europe north of the Mediterranean, North America north of Kansas, and the Andes range in South America are white. Sea level was lower, so landforms are slightly larger than present day.
Am I too late for #30DayMapChallenge Day 14 - A World Map?
I trained a model to predict MODIS RGB imagery from modern climate and applied it to modeled paleoclimate data to simulate a 22,000 year old satellite image of Earth
08.12.2024 20:15 — 👍 42 🔁 6 💬 4 📌 1
Advent of Code 2024
This was my tenth(!) year building 25 days of puzzles for #AdventOfCode. You can solve them all for free! Most people write code to solve them, but you can solve them however you like. I hope they help people become better programmers. 🌟
The first puzzle comes out in two hours: adventofcode.com
01.12.2024 02:57 — 👍 1140 🔁 209 💬 62 📌 22

Version 1.6
Legend for changelogs something big that you couldn’t do before., something that you couldn’t do before., an existing feature now may not require as much computation or memory., a miscellaneous min...
Please help us test the first release candidate for scikit-learn 1.6: pip install scikit-learn==1.6.0rc1
Changelog: scikit-learn.org/1.6/whats_ne...
In particular, if you maintain a project with a dependency on
scikit-learn, please let us know about any regression.
22.11.2024 14:49 — 👍 38 🔁 18 💬 2 📌 2
Many fail to understand how the location of receiving stations impacted early data collection of polar orbiting satellites in the early days. That's the circular pattern in the early data.
In former life I re-processed 1978-1991 vis/ir data back when Dinosaurs Walked (data on tape reels)
13.11.2024 09:53 — 👍 2 🔁 1 💬 0 📌 0
Great work! Having an app to explore the data is really useful.
13.11.2024 18:27 — 👍 1 🔁 0 💬 0 📌 0
We all think we know how much #Landsat and #Sentinel-2 data is in the archives🛰️
🌍 Global edition
🚨 See our new paper and dataset to check 1982-2023 data availability for your study site:
tinyurl.com/yc82epfx
#GEE data viewer: tinyurl.com/322e63p2
22.10.2024 08:43 — 👍 5 🔁 2 💬 0 📌 1
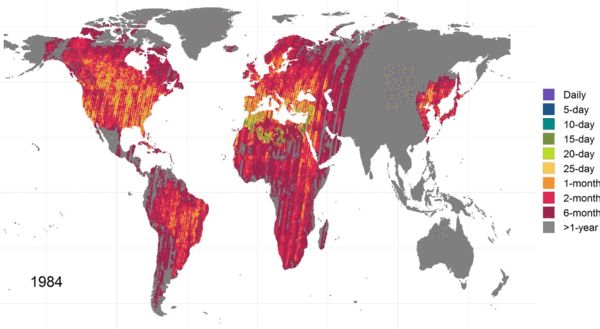
#30DayMapChallenge, Day 12: Time and Space
51 years and 11 million #Landsat scenes, showing global cloud-free (<20%) coverage by path and row since Landsat 1 🛰️
13.11.2024 01:28 — 👍 18 🔁 3 💬 2 📌 1
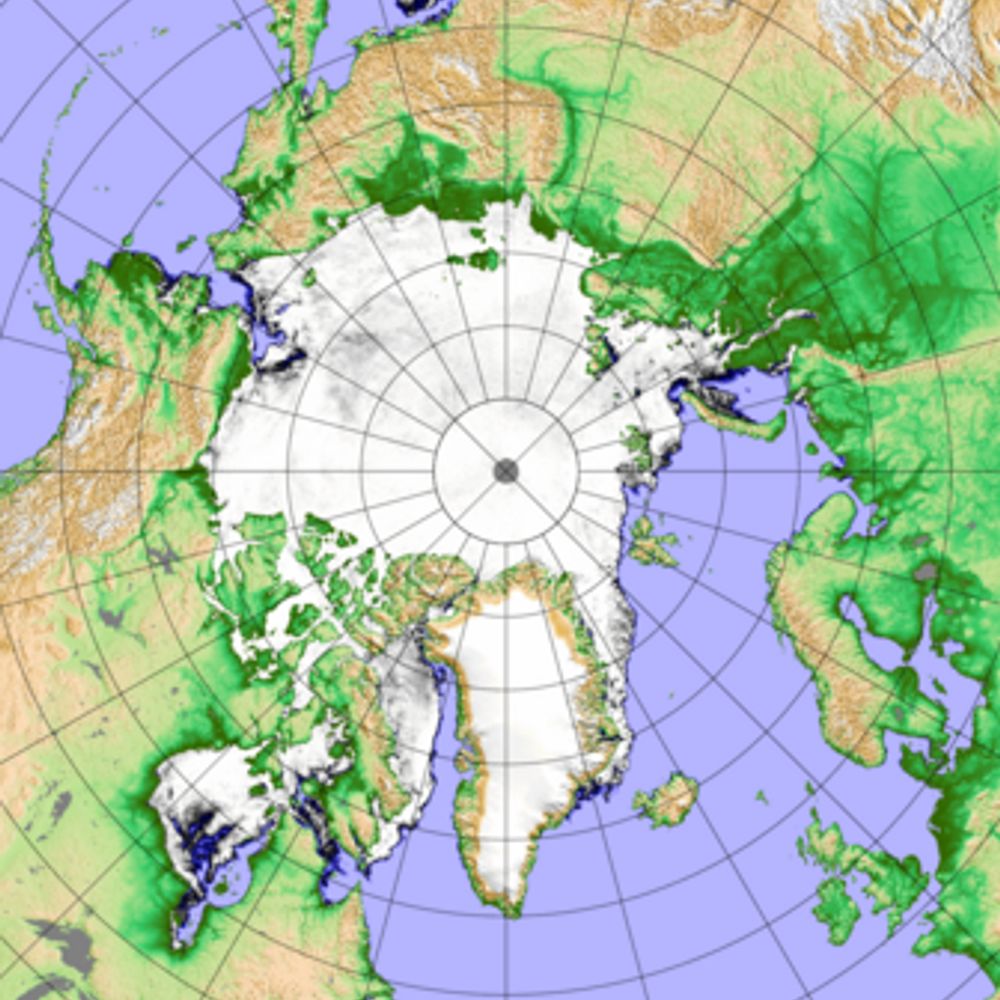
#30DayMapChallenge Day 11: Arctic
One year of MODIS daily mosaic images
Did you know optical satellites like MODIS usually don't capture images over the poles in winter due to lack of sunlight? The "no data" hole grows as we near the winter solstice - and starts closing once daylight returns
11.11.2024 10:18 — 👍 39 🔁 18 💬 2 📌 1
Good point - much easier math at the equator! So in Swahili time, the clock is effectively counting how long the sun has been up/down? That's fascinating!
11.11.2024 20:00 — 👍 1 🔁 0 💬 1 📌 0
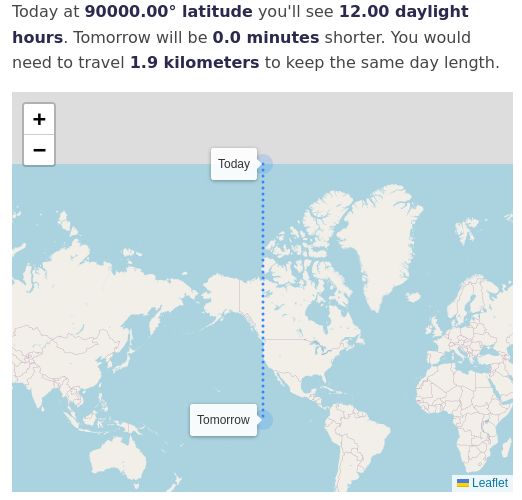
Text that says "Today at 90000.00° latitude you'll see 12.00 daylight hours. Tomorrow will be 0.0 minutes shorter. You would need to travel 1.9 kilometers to keep the same day length." Meanwhile the map shows you traveling from the north pole to the southern hemisphere.
Fun fact, I did zero input validation 👍
10.11.2024 06:56 — 👍 1 🔁 0 💬 0 📌 0
Visualizing how daylight hours change through the year depending on your latitude, for a blog post where I tried to figure out how far you'd need to travel to keep the same day length year-round (spoiler: not very far at first, then REALLY far at each equinox)
www.aazuspan.dev/blog/chasing...
10.11.2024 06:56 — 👍 10 🔁 4 💬 2 📌 0
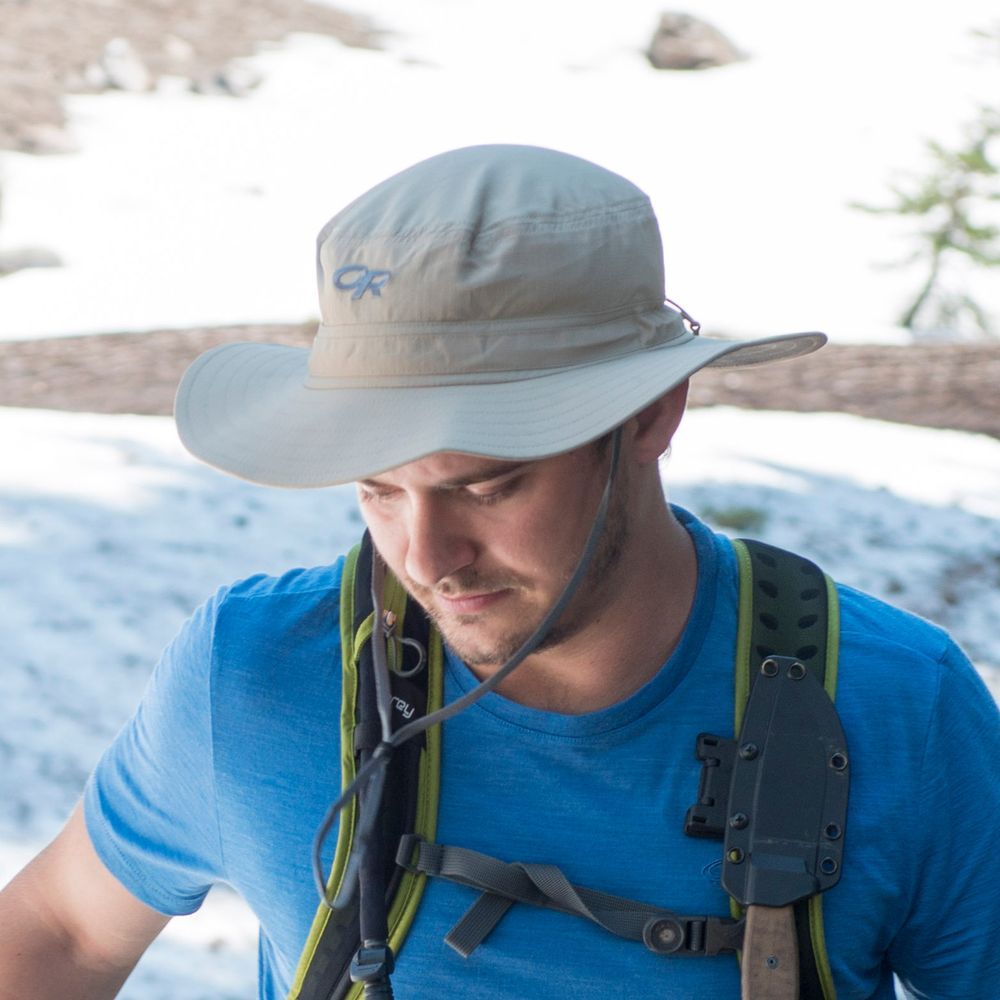
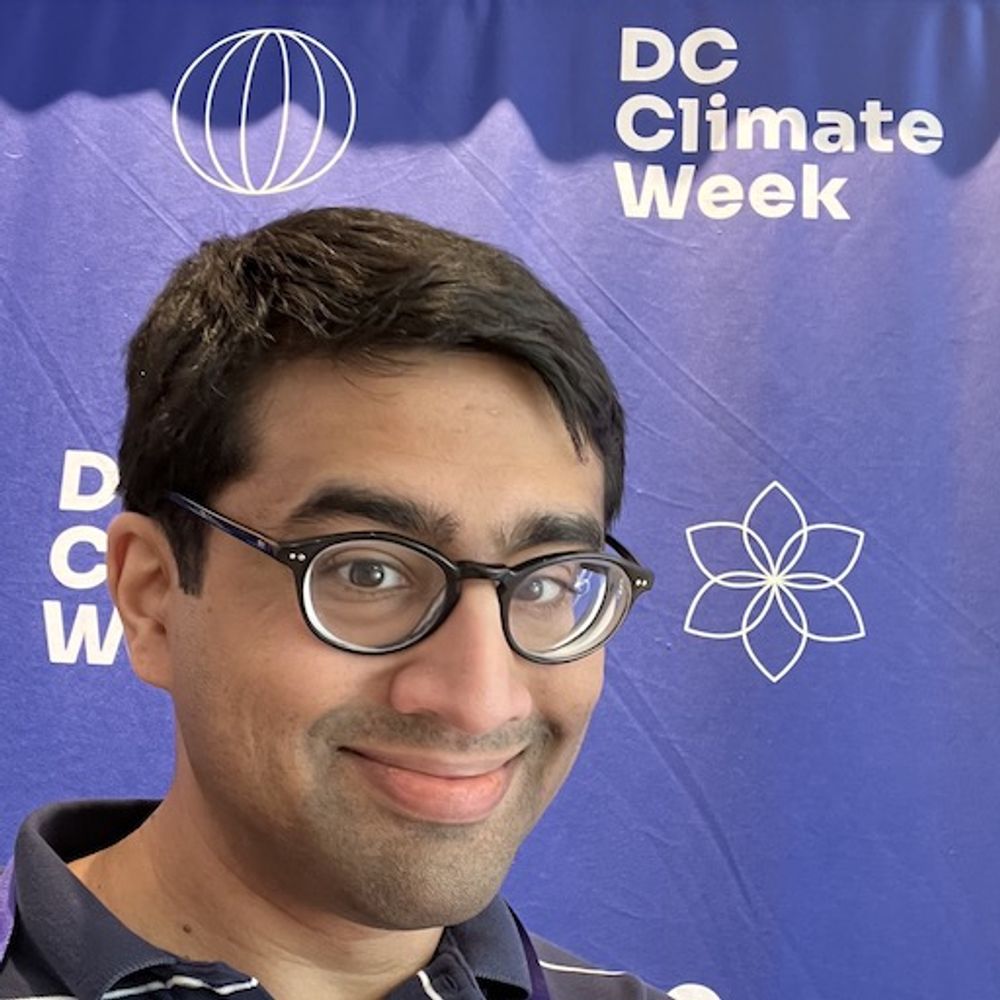
Climate data scientist, analyst and communicator. I use open-source tools, open data, open science and open geospatial for good. Climatebase + Climatematch alum. I help with FedGeoDay + FOSS4G NA. Former science/env. journalist (WaPo, C&EN, Science, etc.)
vintage computers, tubes, the MOnSter6502, cross-sectioned electronic parts, capacitors, and other detritus. coauthor of http://nostarch.com/open-circuits
Physicist, PhD network science & co-founder www.dribia.com. Strictly personal & sci thoughts in this account. Interested in #ML #Sport #Politics
Sedimentology, Geomorphology, Geoinformatics, Big Data Ops for Geoscience — PhD student @ Indiana University. Permanently hanging with my cat Milton. | email: jhgearon@iu.edu
#Satellites #Science #SeaIce #ExtremeLatitudes.
Remote Sensing of Polar Regions at University of Bremen,
Institute of Environmental Physics (IUP).
https://seaice.uni-bremen.de
Humboldt´s Earth Observation Lab focuses on a better understanding of coupled human-environment systems based on remote sensing data and geoinformation.
https://eolab.geographie.hu-berlin.de
Planetary geologist @planetaryscience.bsky.social
https://alexmmorgan.github.io/
Professor of Data Science for Crop Systems at Forschungszentrum Jülich and University of Bonn
Working on Explainable ML🔍, Data-centric ML🐿️, Sustainable Agriculture🌾, Earth Observation Data Analysis🌍, and more...
Australian ecologist into wildfire, wildlife, and the wonders of nature
the cloud platform for weather and climate data teams
https://earthmover.io/
Computer history. Reverse-engineering old chips. Restored Apollo Guidance Computer, Alto. Ex-Google, Sun, Msft. So-called boffin.
Expat: 🇺🇸—>🇦🇪🇫🇷🇪🇸
Data Engineer @ MARS-IMEO-UNEP
Data-Driven Geoscience:
- Computation Scientist
- GeoSpatial Data Engineer
- AI/ML Research Engineer
- MLOPs Dev
- Developer Advocate
I truly believe that software will save science!
The Geospatial Innovation Facility (GIF), UC Berkeley provides leadership & training across a broad array of integrated mapping technologies.
Geographer interested in 🛰️ EarthObservation for 🌿agriculture, 💧water resources, and 🌍 sustainable land management.
F.R.S. FNRS Postdoctoral Fellow 🇪🇺
Earth & Life Institute - UCLouvain 🇧🇪
Earth Observation Lab - HUBerlin 🇩🇪
The official "Resistance" team of U.S. National Park Service. Our website: www.ourparks.org
Husband, dad, veteran, writer, and proud Midwesterner. 19th US Secretary of Transportation and former Mayor of South Bend.
Operator of CelesTrak, the world's first source for orbital element sets and related software and educational materials.
Welcome to the new atlas. 🗺️
Explore at http://Soar.Earth
 21.02.2025 00:28 — 👍 0 🔁 0 💬 0 📌 0