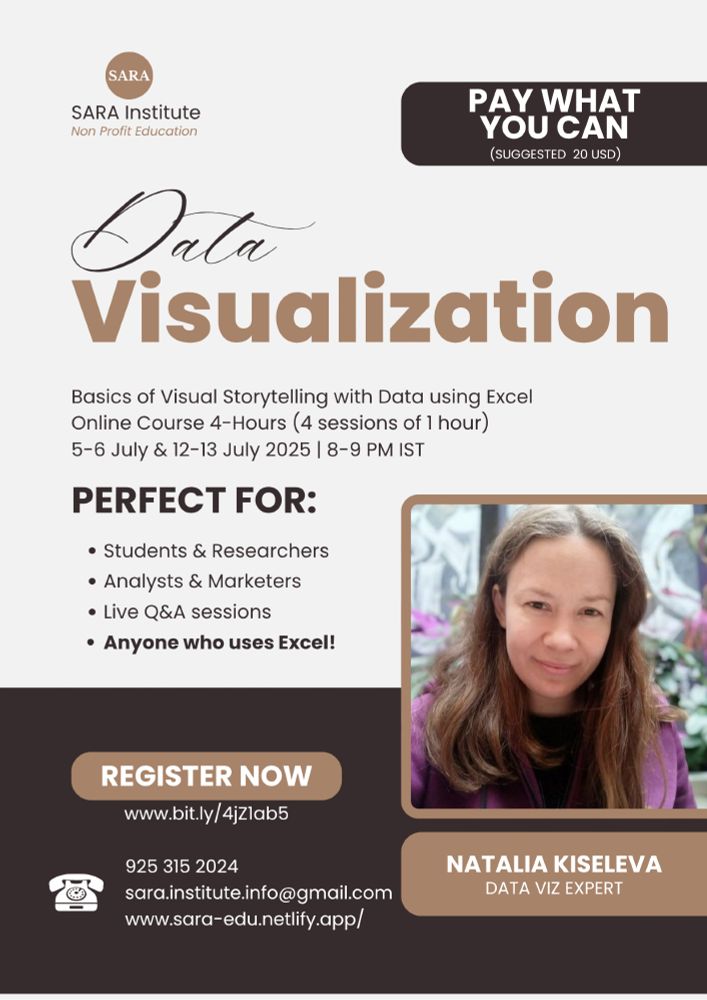
📊 Join SARA’s nonprofit 4-Hour "Data Visualization with Excel" online course — pay what you can 💙
Thank you🌟Dear Natalia Kiseleva🌟(eolay.tilda.ws/en)
🔗 Registration Link: bit.ly/4jZ1ab5
📍 Learn more: sara-edu.netlify.app/online/data-... ⤵️
#DataViz #Excel #CodingForEveryone #SARA
24.06.2025 13:33 — 👍 4 🔁 2 💬 0 📌 2
Wow!! Love it! 😍 DnD and radat chart! Super!
01.06.2025 19:35 — 👍 2 🔁 0 💬 0 📌 0
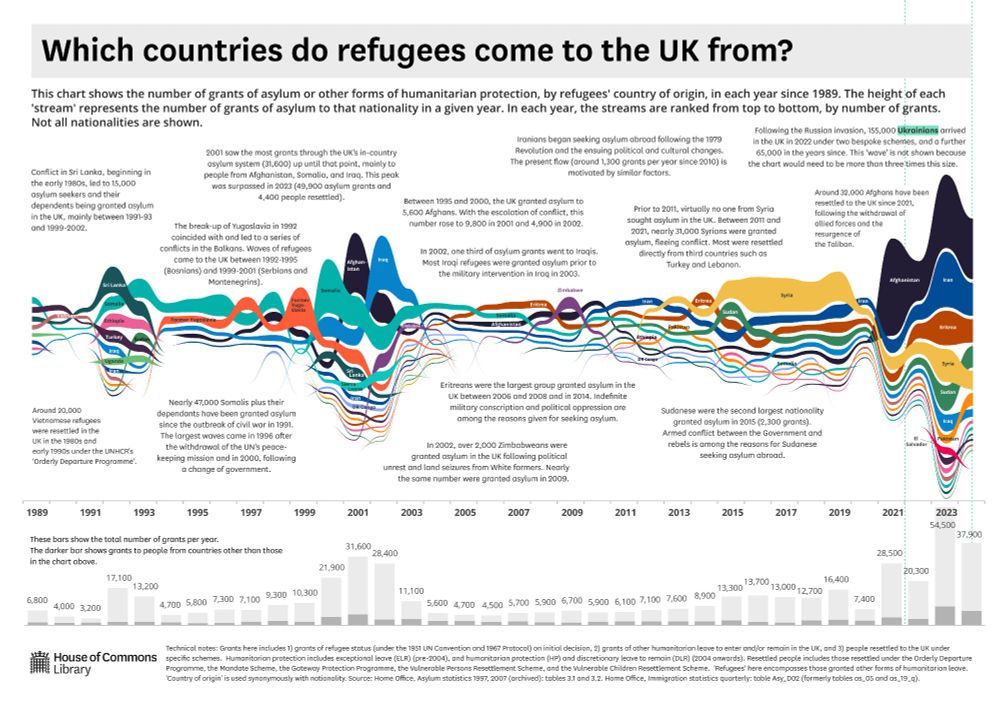
What were the main nationalities of refugees to the UK in 2024? How about in 1989? The answers for some of these years might surprise you.
04.03.2025 15:24 — 👍 30 🔁 13 💬 1 📌 2
Yes! ❤️❤️❤️
24.04.2025 15:14 — 👍 0 🔁 0 💬 0 📌 0
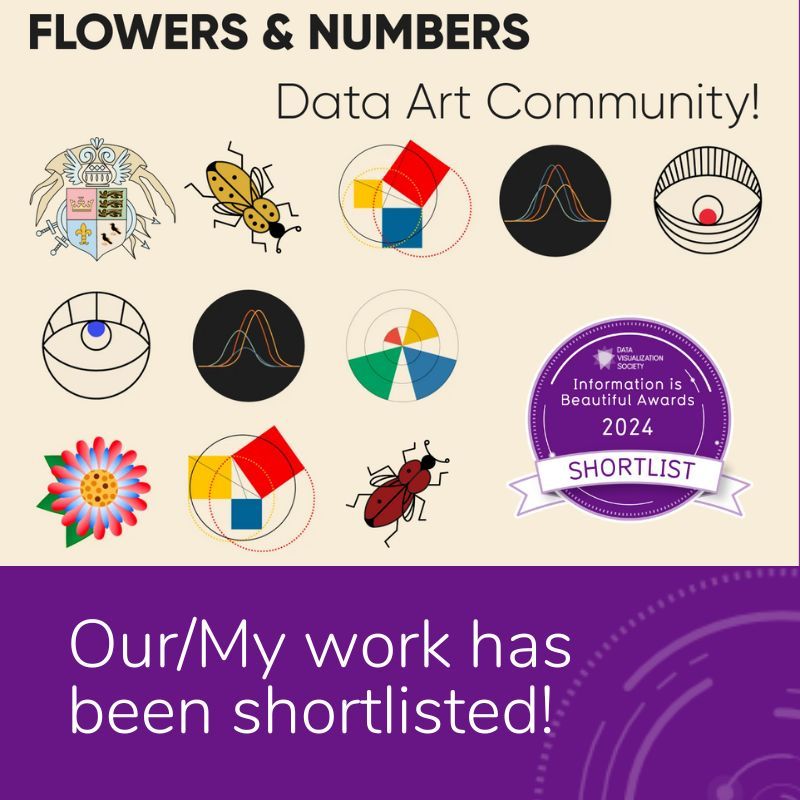
Our data art community made it to the shortlist of the Information is Beautiful Awards!!
24.04.2025 13:41 — 👍 3 🔁 0 💬 1 📌 0
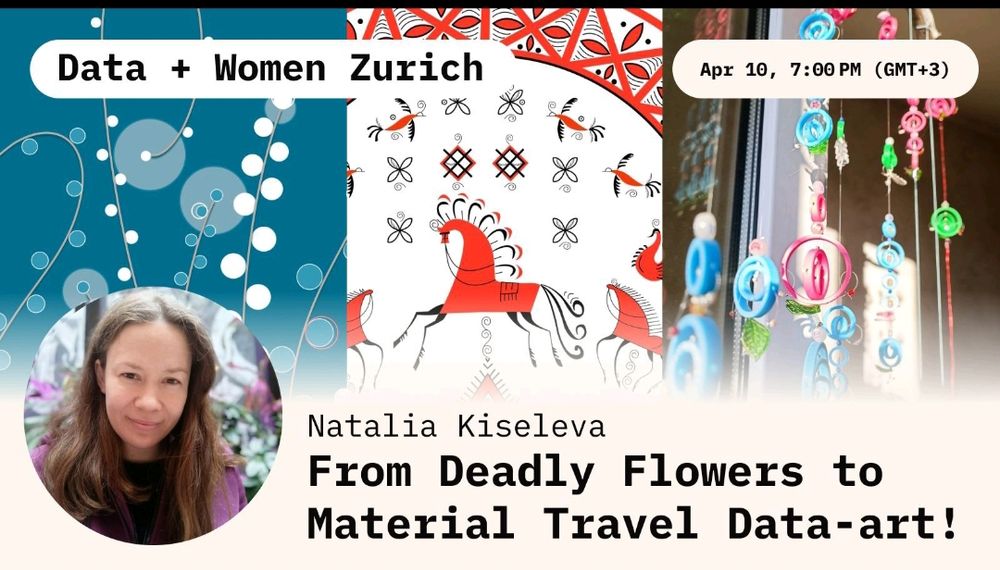
I’ve been invited to a wonderful community to share my data art projects!
Join me at Data+Women Zurich for our next virtual event, “From Deadly Flowers to Material Travel Data-Art!” on April 10, 2025.
usergroups.tableau.com/events/detai...
02.04.2025 19:43 — 👍 1 🔁 0 💬 0 📌 0
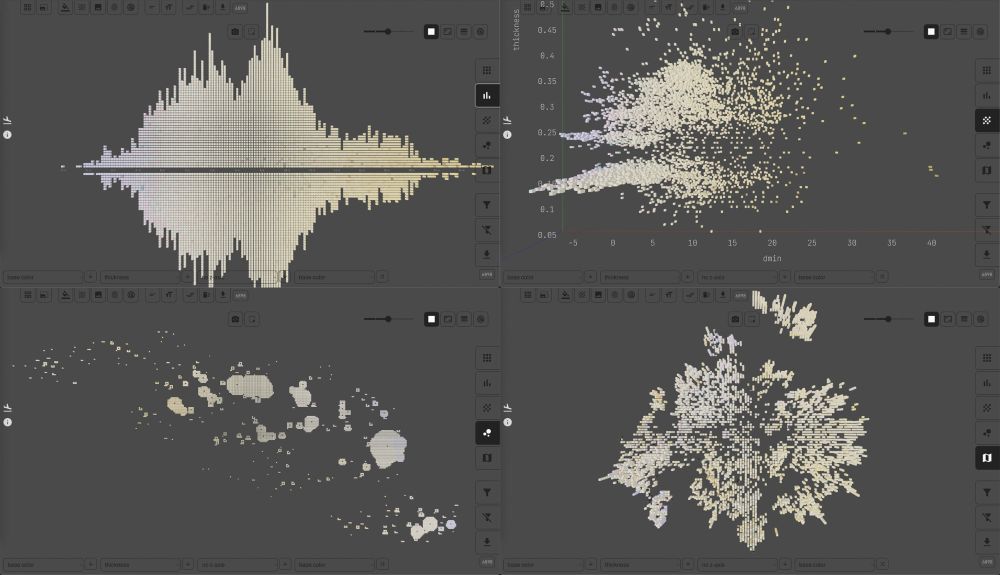
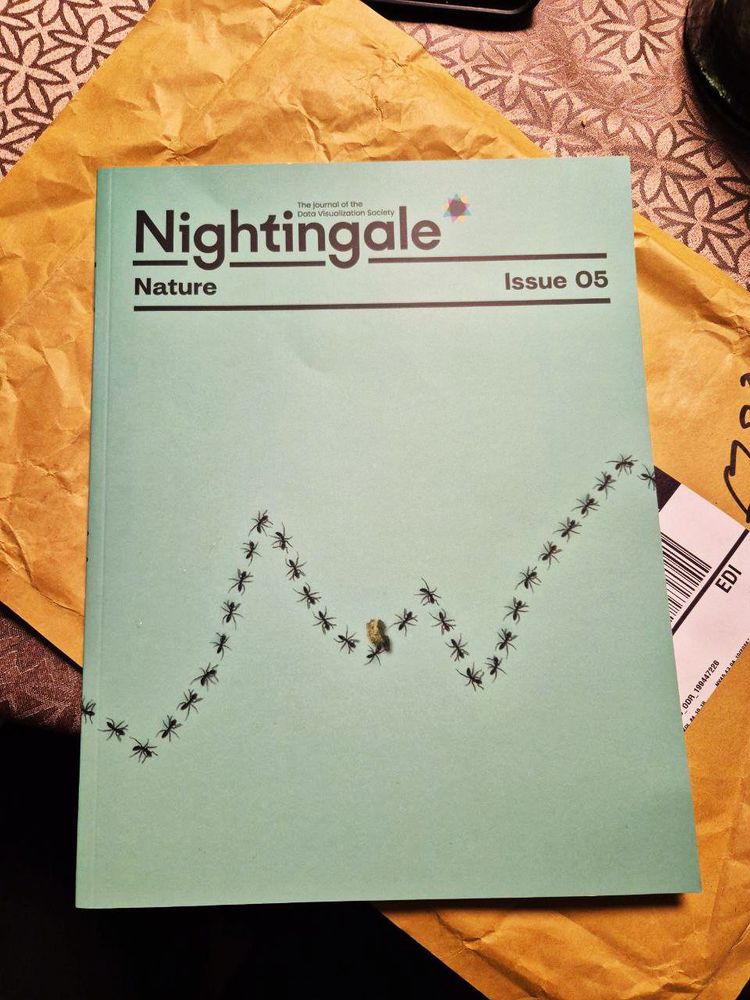
Paperbase: A Window into Photographic Paper History, Nightingale
The Lens Media Lab at Yale University’s Institute for the Preservation of Cultural Heritage has created Paperbase, an interactive platform for exploring...
Want to explore the technical history of photography through data visualization?
Natalia Kiseleva delves into Paperbase, an interactive platform and its incredible journey to analyze the world's largest collection of gelatin silver photographic papers.
nightingaledvs.com/paperbase-a-...
26.03.2025 16:00 — 👍 7 🔁 2 💬 0 📌 0
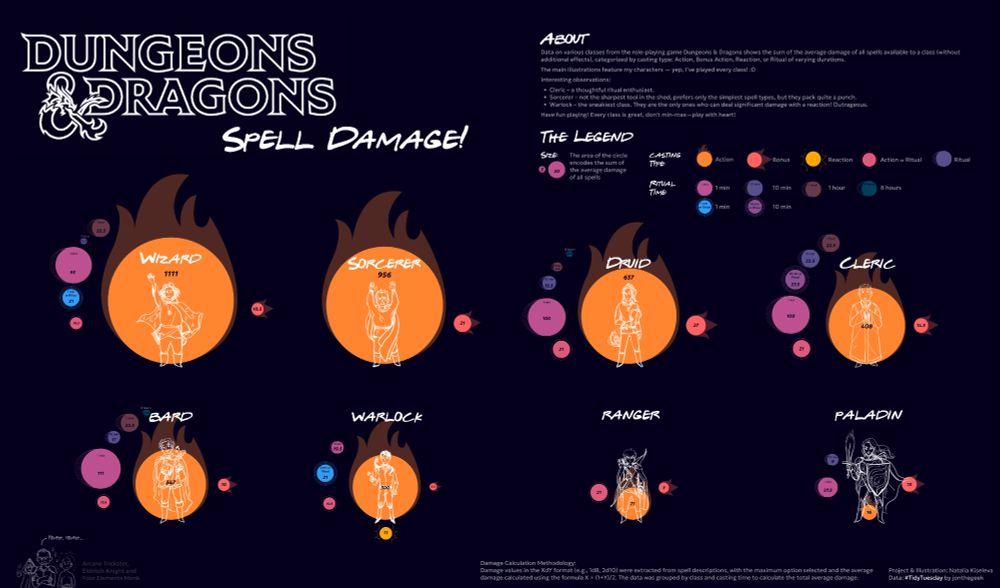
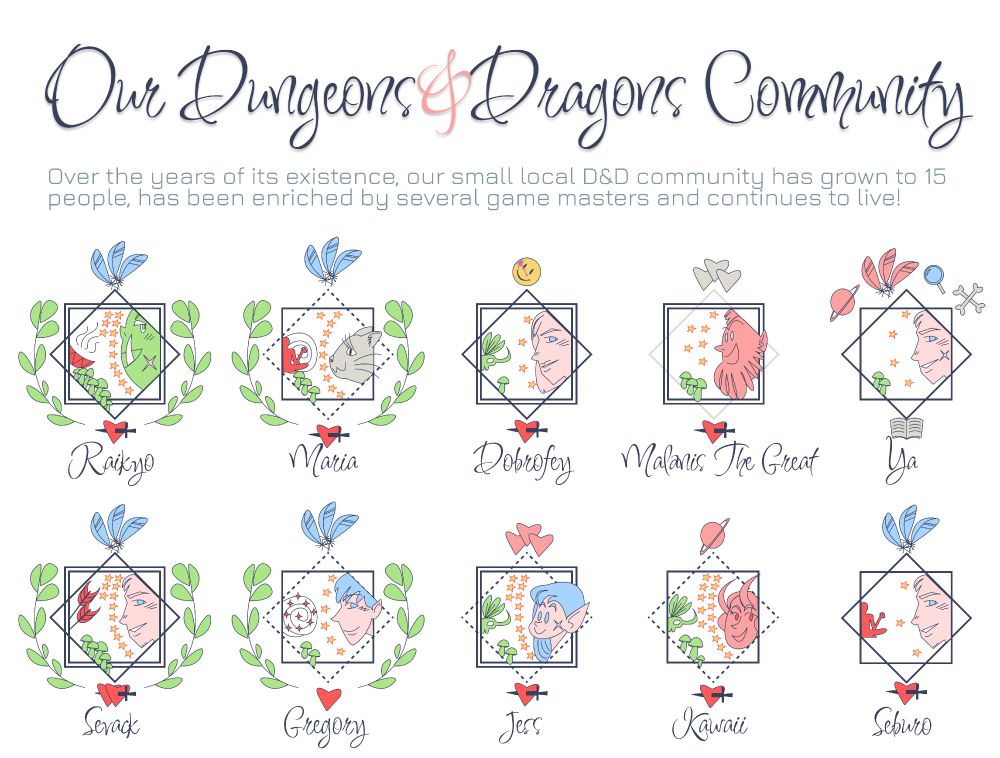
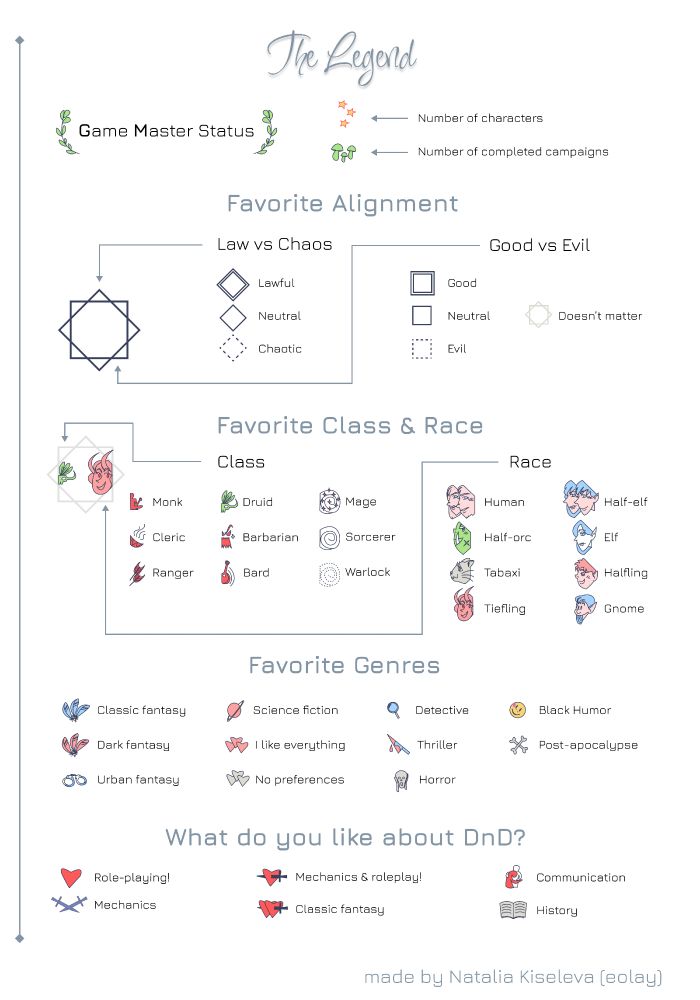
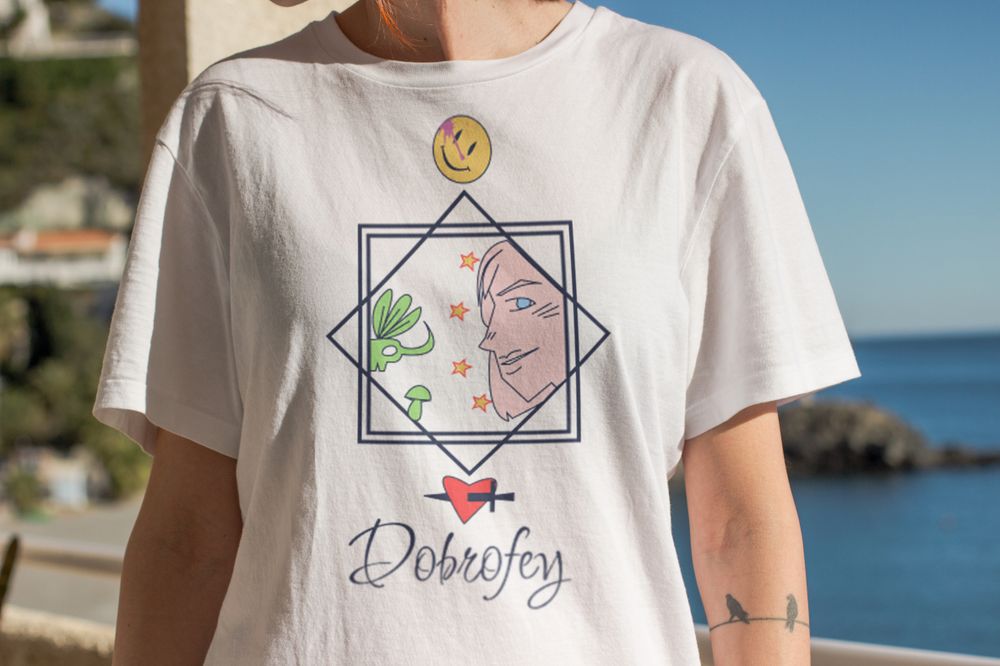
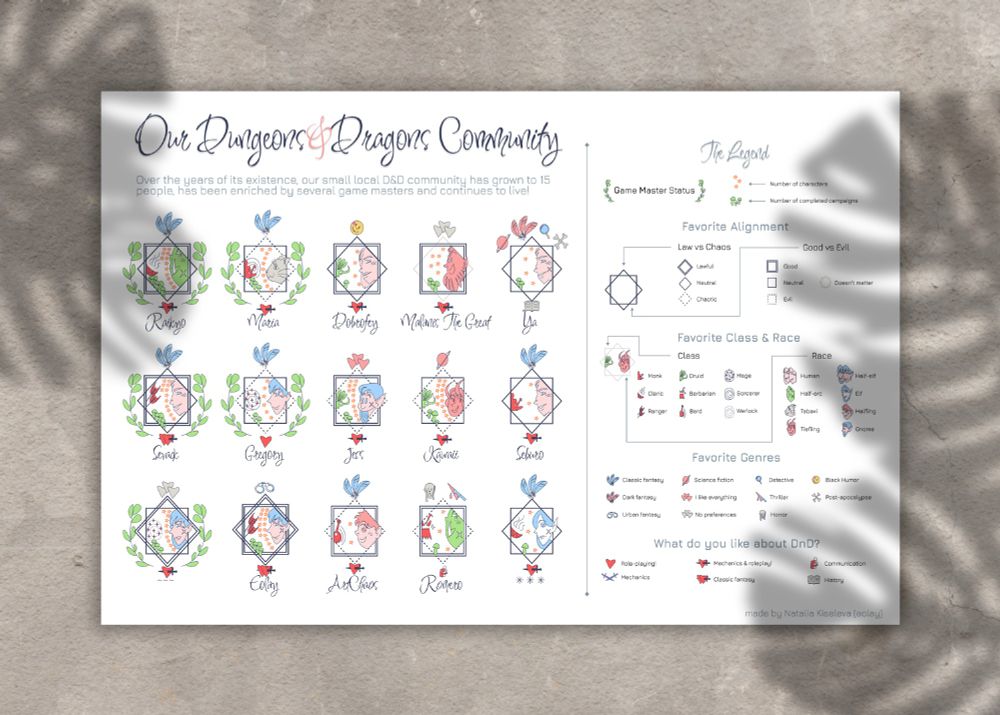
DnD Spell Damage Project! 🎲
Analyzed average spell damage by class and casting type using a DnD dataset for #TidyTuesday!
I've played all these classes, so instead of generic art, I drew my own characters! 😄
Do you play? What's your favorite class? 😎
#dungeonsanddragons #dnd #dataviz
03.01.2025 12:50 — 👍 17 🔁 0 💬 0 📌 0
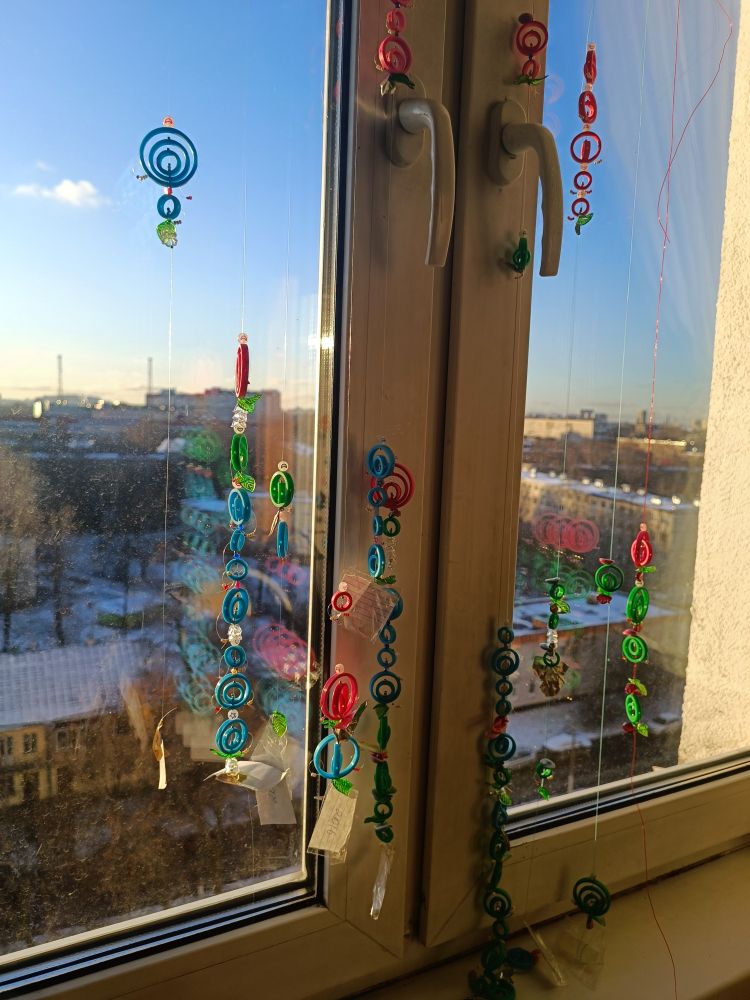
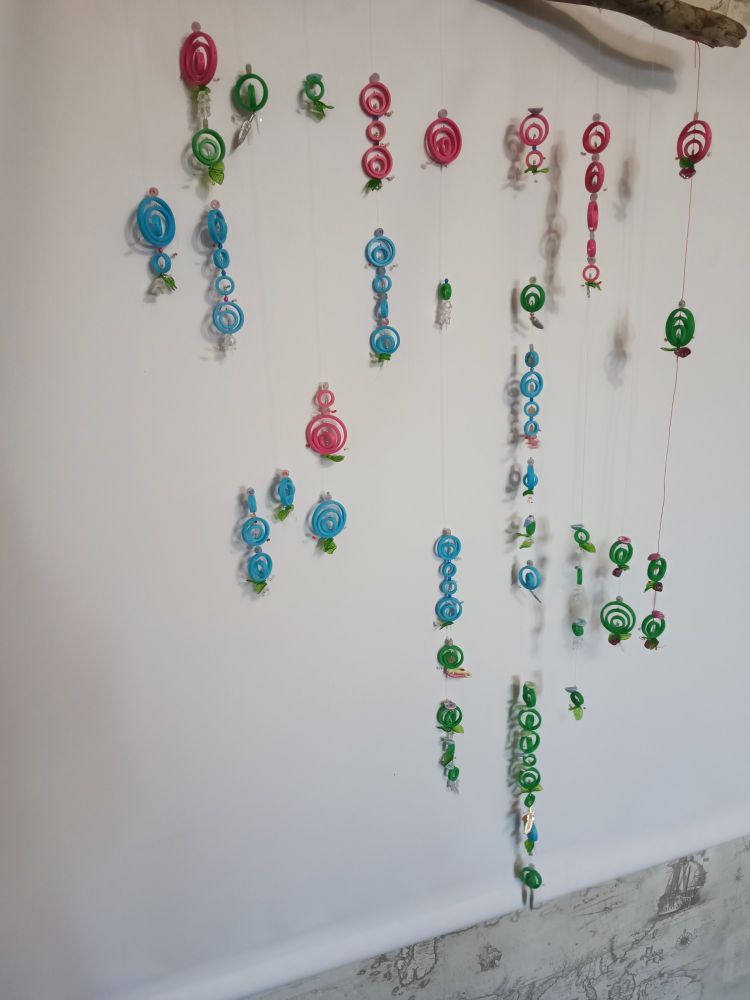
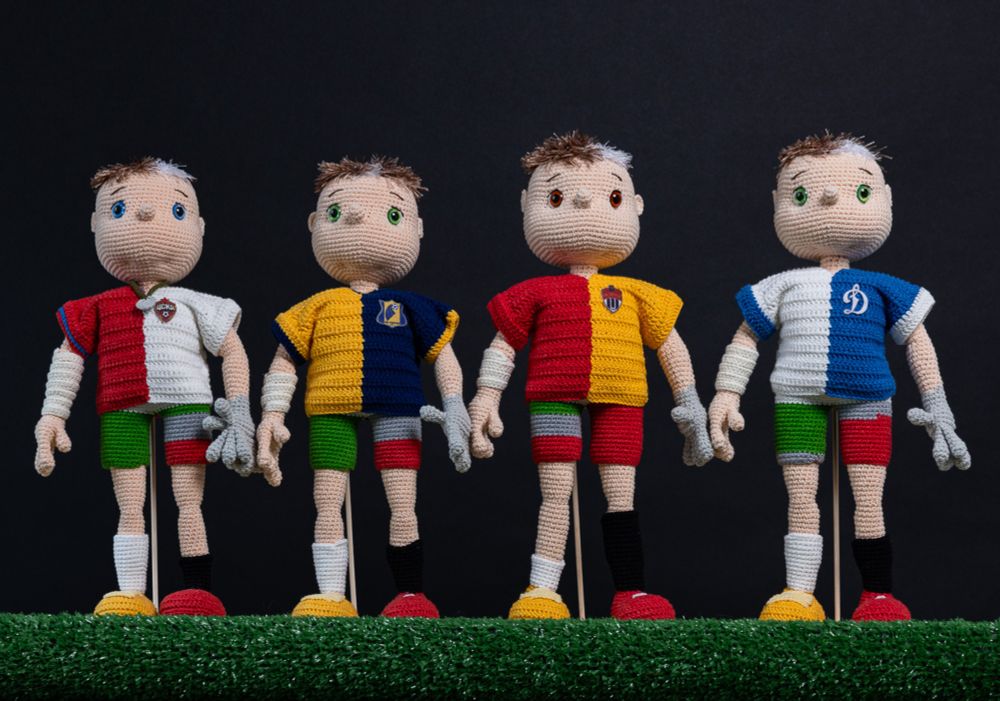
Little experiment! It was fun 😁😁😁
#materialdataviz
13.11.2024 17:56 — 👍 1 🔁 0 💬 0 📌 0
Probably just a coincidence; I just really like shades of blue! I’m afraid by the time I started working with blueprints, they were already white... So I missed the blue period!
31.10.2024 14:47 — 👍 1 🔁 0 💬 0 📌 0
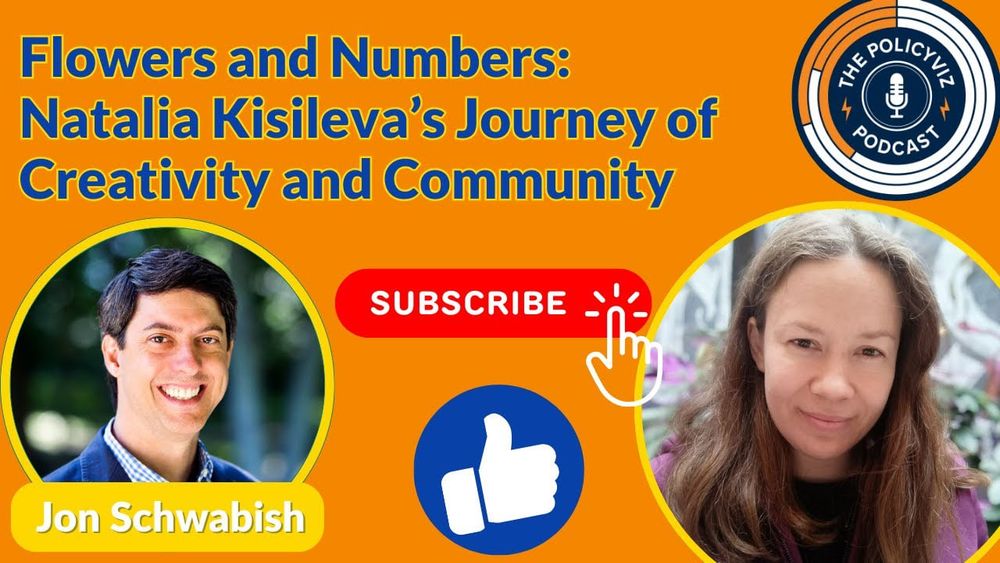
PolicyViz Podcast about Data Art! 😍
The incredible Jonathan Schwabish podcast!
I am so excited to be a guest there and talk about data art, and my journey in data visualization!
policyviz.com/podcast/epis...
#DataVisualization #DataArt #PolicyVizPodcast #DataStorytelling
23.10.2024 14:34 — 👍 0 🔁 0 💬 0 📌 0
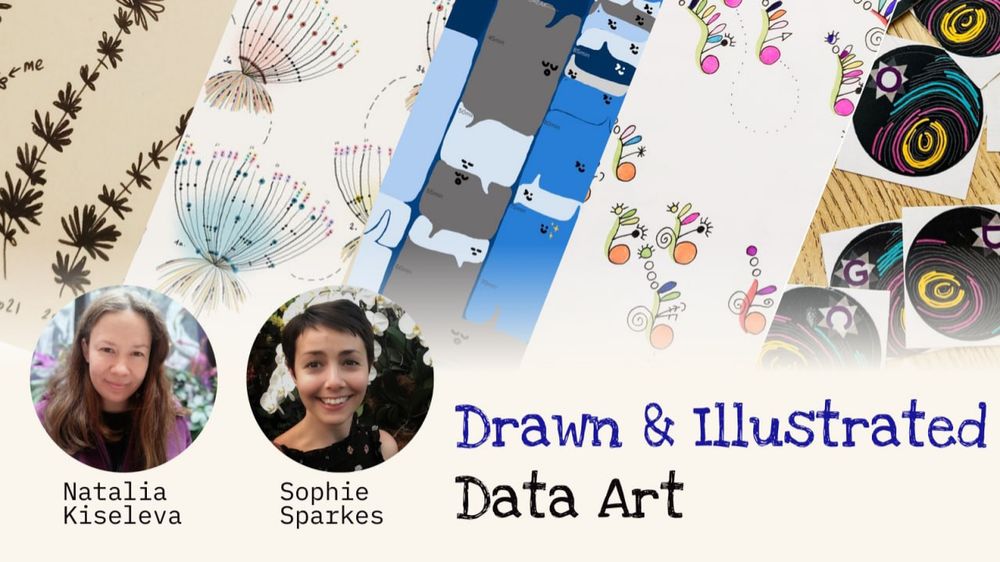
Check our with Sophie Sparkes video about illustrated and drawn data art! 🥰🥰🥰
youtu.be/5Hwbd-LdDcU
#dataviz #dataart #drawingdata
10.09.2024 09:18 — 👍 12 🔁 1 💬 0 📌 0
Beautiful!! Thank you for sharing.
Ow! Have you seen this: stat.columbia.edu/~gelman/rese... (Alberto Cairo shared it in his substack Newsletter)
09.09.2024 14:56 — 👍 0 🔁 0 💬 0 📌 0
Enjoy the videos and music you love, upload original content, and share it all with friends, family, and the world on YouTube.
YouTube
Who killed the world? We analyzed the top 200 sci-fi films from every decade. Here’s what we learned.
📹 Watch the video version: youtube.com/watch?v=nRQ2...
💻 Or play around with the interactive version:
pudding.cool/2024/07/scifi/
12.07.2024 16:05 — 👍 5 🔁 3 💬 0 📌 0
Wow!
05.07.2024 23:16 — 👍 1 🔁 0 💬 0 📌 0
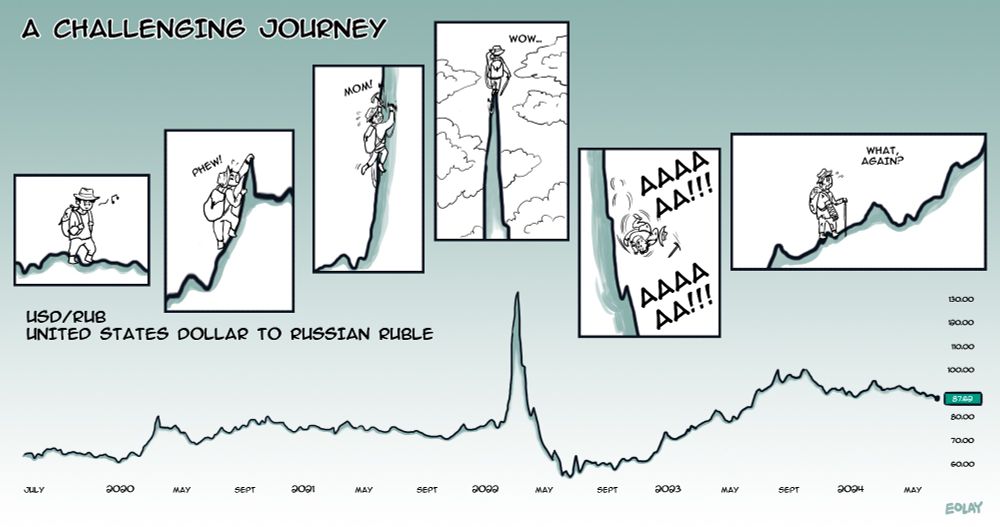
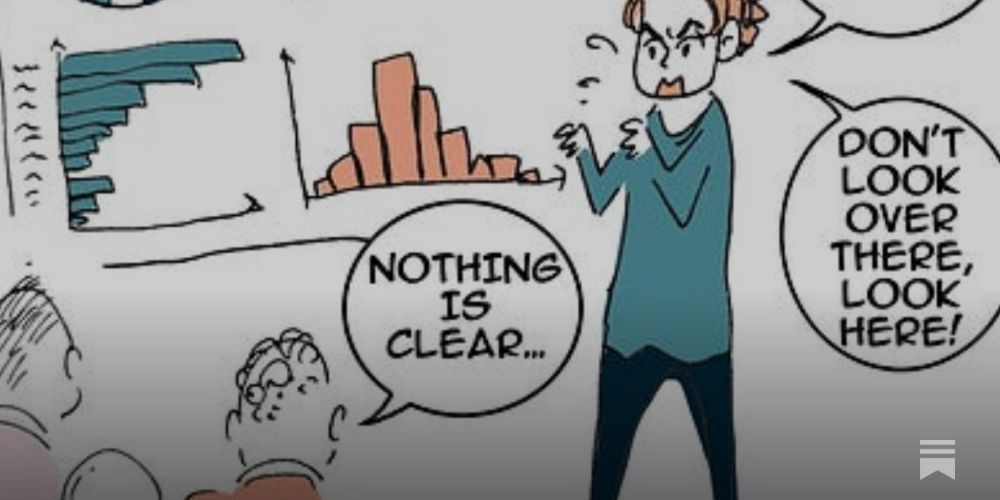
I spontaneously drew this data comic.
At first, it seemed more intriguing, but it's still quite straightforward.
I initially wanted to make a bar chart, but this type of data is rarely presented in bars.
What do you think of this adventure? 😥
#datacomics #dataviz
27.06.2024 12:13 — 👍 1 🔁 0 💬 0 📌 0
Beautiful! 🥰
22.06.2024 18:51 — 👍 0 🔁 0 💬 0 📌 0
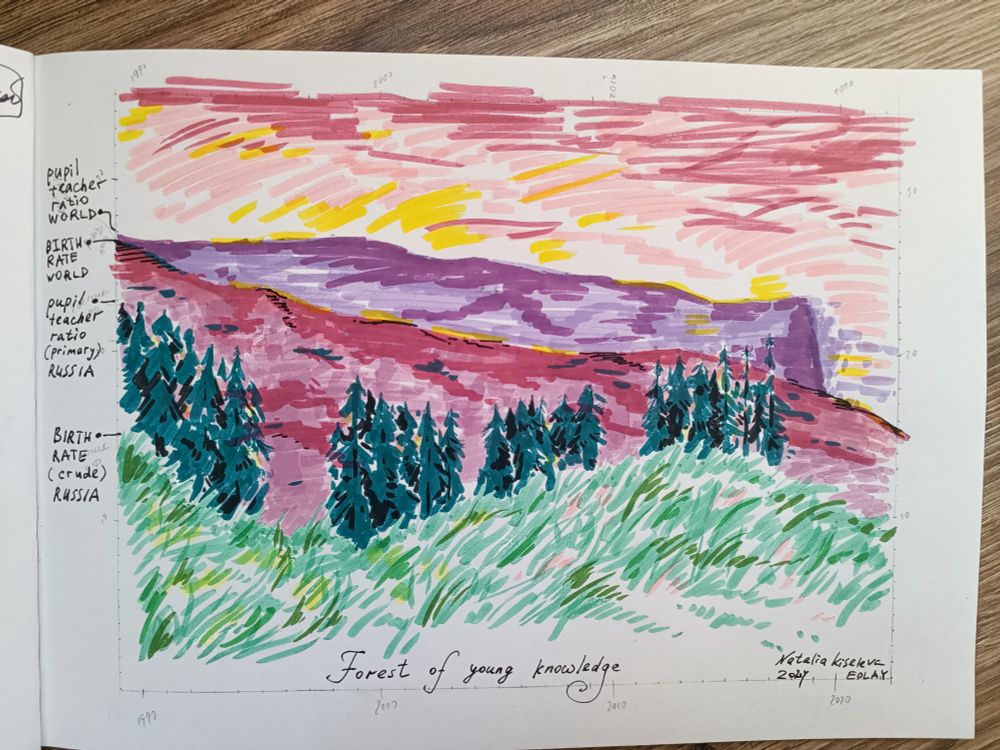
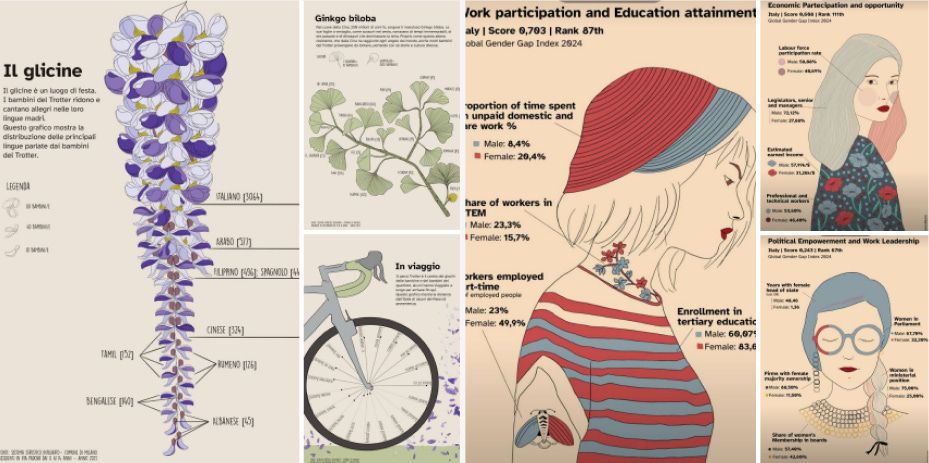
Data landscape!
On data about children and teachers.
It isn't perfect, but I'm glad, I've done it! 🥰
#dataviz #dataart #datalandscape
14.06.2024 15:20 — 👍 2 🔁 0 💬 0 📌 0
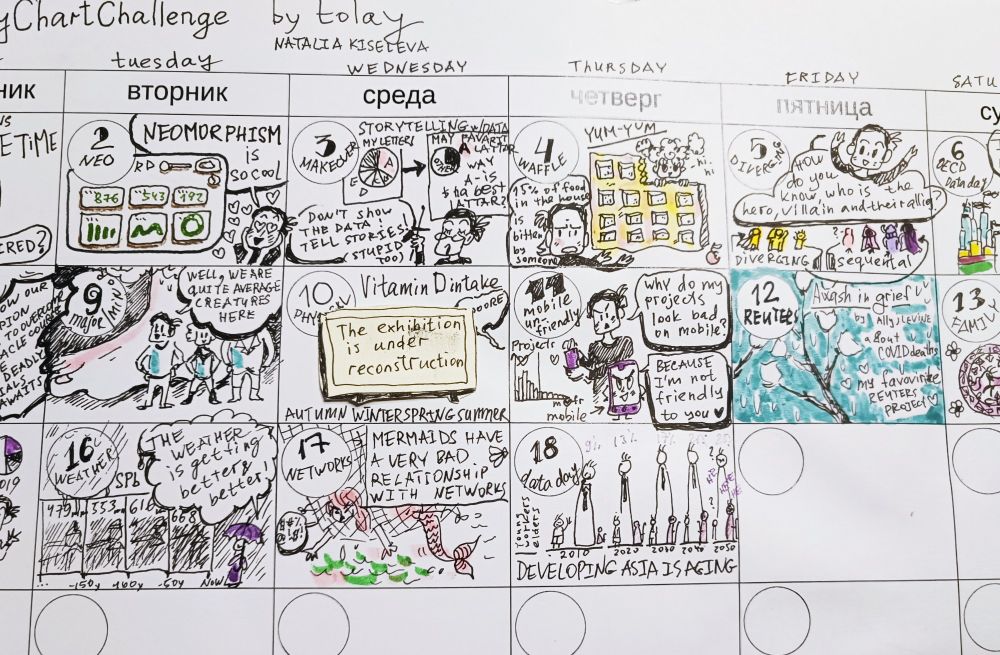
#30DayChartChallenge bonus! 😤👌
08.06.2024 18:00 — 👍 1 🔁 0 💬 0 📌 0
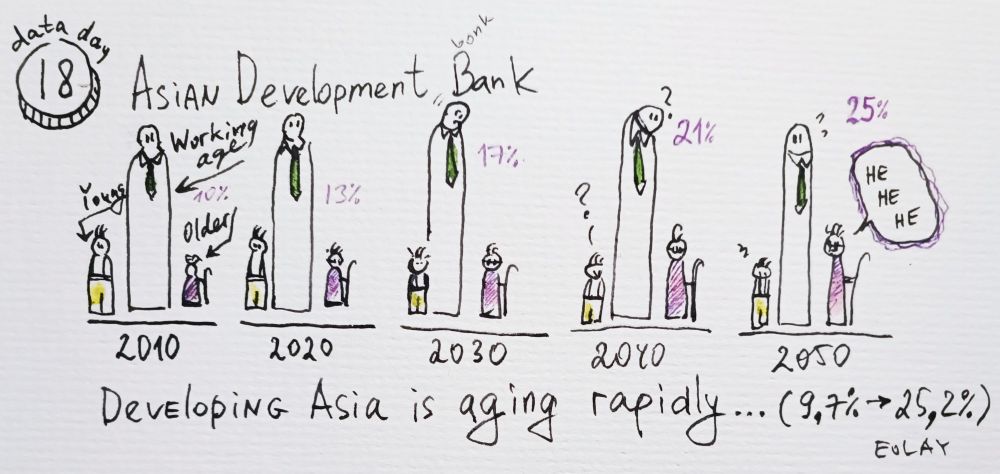
#Day18 #30DayChartChallenge
Asian Data. Elders domination is closer and closer! 😎👌
08.06.2024 18:00 — 👍 0 🔁 0 💬 0 📌 0
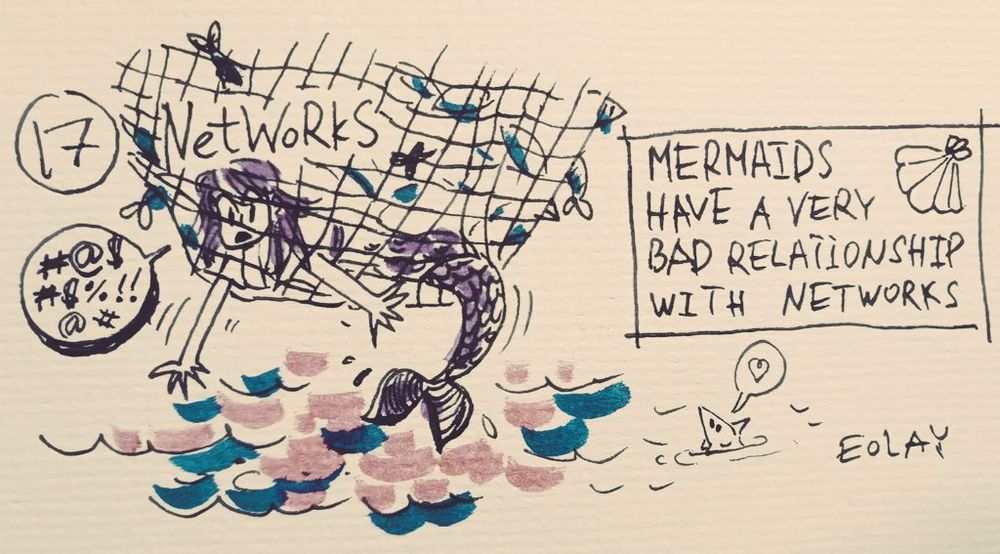
#Day17 #30DayChartChallenge
Better later than never 🌝✨
Networks!
(don't ask)
08.06.2024 17:59 — 👍 1 🔁 0 💬 0 📌 0
Then there are also:
@eolay.bsky.social
@tulpinteractive.com
@cogley.bsky.social
@allitorban.bsky.social
@theneilrichards.bsky.social
@mohamadwaked.bsky.social
@jacqueschrag.com
@seblammers.bsky.social
Give them a follow as well.
Would like to see @bsky.app to be our new #dataviz hangout
07.06.2024 13:03 — 👍 11 🔁 4 💬 3 📌 0
Dataviz folks on Bluesky who don’t have nearly enough followers. 📊
@cleverfranke.bsky.social
@rubenmathisen.bsky.social
@sonjakuijpers.bsky.social
@womenindataviz.bsky.social
@krisztinaszucs.bsky.social
@yuriengelhardt.bsky.social
@emiliaruzicka.bsky.social
@mhernandez.bsky.social
Do it!
07.06.2024 12:31 — 👍 19 🔁 7 💬 4 📌 0
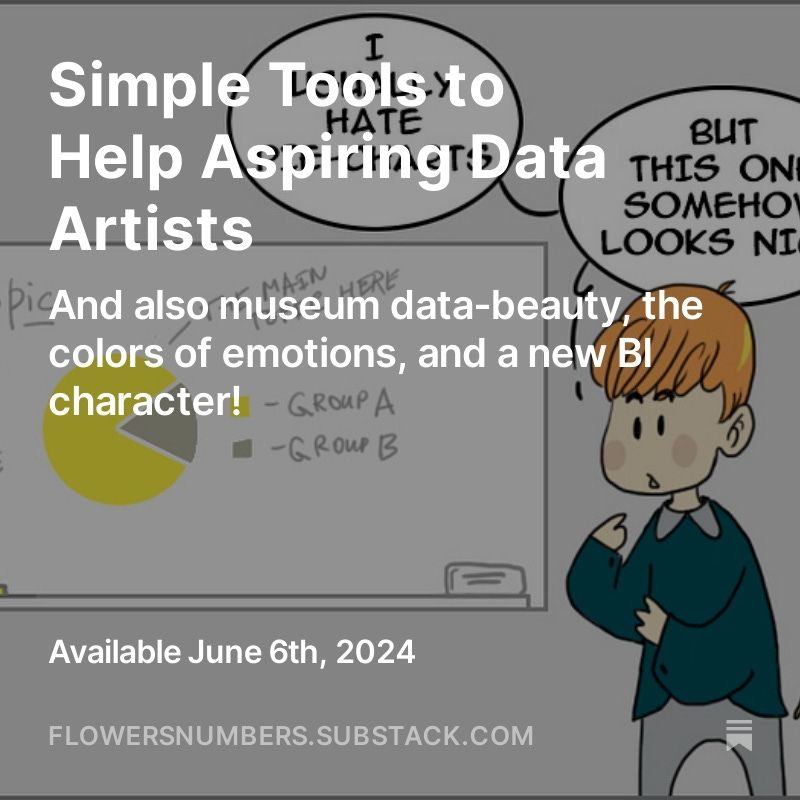
Simple Tools to Help Data Artist! In this newsletter, I've gathered simple and useful free resources that will be helpful for beginner data artists!
open.substack.com/pub/flowersn...
06.06.2024 09:24 — 👍 0 🔁 0 💬 0 📌 0
AI Dev Rel @ Google; doesn't eat animals🐣; RA poly queer🌈; dancer💃
Statistics expert and author of 'Sum of Us' (2025) and 'Bad Data' (2022). Research Affiliate at the Oxford Migration Observatory.
Formerly of the House of Commons Library. Now writing and podcasting on Substack https://georginasturge.substack.com/
Climate scientist at the National Centre for Atmospheric Science, University of Reading | IPCC AR6 Lead Author | MBE | Views own | https://edhawkins.org
Warming Stripes: http://www.ShowYourStripes.info
🗣️#RStats #DataScience #Dogs
@dslc.io Executive Director
#TidyTuesday poster
🔗http://linkedin.com/in/jonthegeek
🔗http://github.com/jonthegeek
Data-artist, designer, dataviz fan
Blog: https://naukaidannye.netlify.app/blog/
RSources: https://rsources-en.netlify.app/
#rstats #rspatial
HR Analyst | Data visualization enthusiast
https://t.me/weekly_charts
Tableau Evangelist/Data Visualization Consultant at Moxy Analytics | Hall of Fame Tableau Visionary | 6X Tableau Public Ambassador | One Half of the Flerlage Twins
i write the data-driven politics newsletter Strength In Numbers: gelliottmorris.com/subscribe
wrote a book by the same name wwnorton.com/books/Strength-in-Numbers
polling averages at @fiftyplusone.news
formerly @ 538 & The Economist. email, don't DM, me
Columnist and chief data reporter the Financial Times | Stories, stats & scatterplots | john.burn-murdoch@ft.com
📝 ft.com/jbm
Creator of 📰 News feeds, @xblock.aendra.dev, @moji.blue, founder of @shoots.green, co-organiser @atproto.london.
Opinions my own. Not a journalist or an engineer, but a secret third thing (depressed).
she/her/ze/hir 🏳️⚧️
🌐 aendra.com
🗞️ ft.com/æ
Digital humanities, data science, AI, eating, professor of Data & Decision Science and English. Coauthor #DataFeminism w/ @kanarinka. PI #AIAInetwork. Views my own.
Math, hockey, viz, apocrypha
Assoc Prof Computer Science and Communication Studies at Northwestern. Infovis, HCI. Author of tidybayes & ggdist R pkgs. he/him. 🏳️🌈 https://mjskay.com/
Co-director https://mucollective.northwestern.edu
Co-founder https://journalovi.org
Already living in the future of news at Newspack. Board at @muckrock. Former @propublica. Hoping for the best.
Writing about tech, power, data visualization, social media, disability. Assistant prof of computational media @ MIT. 🇹🇼
crystaljjlee.com
Into creative ML/AI, NLP, data science and digital humanities, narrative, infovis, games, sf & f. Consultant, ds in Residence at Google Arts & Culture. (Lyon, FR) Newsletter arnicas.substack.com.
— Founder of Our World in Data
— Professor at the University of Oxford
Data to understand global problems and research to make progress against them.
Climate scientist, geologist, and catastrophe modeler, Liberty Mutual. Posts on all things hurricane, wildfire, flood, earthquake, tornado. Sassy takes are mine not employer's.
📍Oakland, CA
Website: hereidk.strikingly.com