
There are less than 5 job vacancies in rotherham for every 100 people claiming universal credit

In Pendle and Hartlepool there are around 5 job vacancies for every 100 people claiming universal credit
NEW: The government wants to boost employment among people who receive universal credit - but our analysis suggests a lack of good-quality jobs is making this near impossible. And, in some local authorities, there’s as few as 5 vacancies for every 100 people on universal credit…
11.02.2026 10:07 —
👍 19
🔁 16
💬 1
📌 2
Poverty is deepening.
🔎 Our #UKPoverty2026 report was launched this morning.
People in very deep poverty now make up the biggest group of people in poverty, at 6.8 million people.
This is unacceptable for the fifth richest country in the world, and it has consequences.
27.01.2026 07:53 —
👍 189
🔁 172
💬 6
📌 31

Benefit expenditure and caseload tables 2025
Historical and forecast benefit expenditure and caseload data usually consistent with the annual spring and autumn Budgets or Statements.
While spending on disability benefits will make up more of this spend (from 1.1% of GDP in 24/25 to 1.4% in 29/30), applications for PIP have started to fall and the OBR expect them to land around halfway back toward pre-pandemic levels
Lots more in the data tables here: www.gov.uk/government/p...
18.12.2025 11:33 —
👍 2
🔁 0
💬 0
📌 0

New DWP forecasts show that spending on working-age social security is expected to be stable over the rest of the parliament at 5.1% of GDP
This is a slight increase from the Spring, but is mainly for welcome reasons like removing the two-child limit and reversing some of the cuts put forward then
18.12.2025 11:33 —
👍 14
🔁 10
💬 1
📌 0

The latest Personal Independence Payment data shows a further slowing of applications, with average claims down 7% in the year to October
The largest reduction in new claims has been from people over 45
The OBR has said it expects monthly applications to fall to around 60,000 during the parliament
16.12.2025 09:51 —
👍 5
🔁 5
💬 0
📌 1
A helpful explainer here from Louise on the impact of system change on the UC health caseload
It's also worth noting that up to 2023, 30% of the rise in the caseload was because of expected policy and demographic changes
12.12.2025 10:20 —
👍 3
🔁 1
💬 0
📌 0

Far from the main reason why the article falls well short of Sofie's
But it's quite impressive to talk about *modern* economic thought and not name anyone that's been alive since the 19th century...
12.12.2025 10:14 —
👍 0
🔁 0
💬 0
📌 0

Scrapping the two-child limit will significantly reduce child poverty over the parliament and improve the living standards outlook for low-income families
But more is needed to improve incomes, through higher earnings, lower housing costs, and a stronger social security system
26.11.2025 17:36 —
👍 3
🔁 0
💬 0
📌 0

Brilliant to see that the two-child limit will be scrapped, lifting 450,000 children out of poverty in 2029/30
26.11.2025 12:08 —
👍 10
🔁 1
💬 0
📌 1

UK inflation rate falls to 3.6% in year to October
Prices have been rising more slowly in the twelve months to October.
📊 Latest figures out from the ONS this morning showed that inflation slowed to 3.6%.
But food inflation rose to 4.9%, up from 4.5% in the previous month.
The outlook for around 7 million households going without essentials in the UK remains extremely stark.
www.bbc.co.uk/news/article...
19.11.2025 08:19 —
👍 22
🔁 17
💬 3
📌 3
The response is here: committees.parliament.uk/publications...
19.11.2025 07:47 —
👍 0
🔁 0
💬 0
📌 0

Good to see DWP accepting much of the Work and Pensions Committee's recommendations for improving jobcentres
Moving from a one-size fits all to a tailored approach will improve the relationship people have with their work coach, help them find better jobs, and improve their economic security
19.11.2025 07:47 —
👍 1
🔁 0
💬 1
📌 0
Truly fascinating stuff here! Kitchen table concerns vs things your newsfeed tells you to worry about…
17.11.2025 14:41 —
👍 7
🔁 3
💬 2
📌 0
It really is worth taking the time to hear from people like “Mary,” who fled from Zimbabwe 20 years ago, to understand what life is like when the law denies you the chance to call the country where you’ve made your life home
16.11.2025 19:54 —
👍 45
🔁 30
💬 1
📌 0
Practical and progressive action here from the govt. Healthy workers benefit their companies and society overall. Right that employers are part of making that happen.
06.11.2025 09:22 —
👍 1
🔁 2
💬 0
📌 0
These measures would give social security a much needed boost, support the economy, and go a long way in protecting children's living standards
29.09.2025 10:28 —
👍 0
🔁 0
💬 0
📌 0

Improvements of this scale are urgently needed.
Families with children saw unprecedented reductions in their income last parliament and could do so again given the poor economic outlook
29.09.2025 10:28 —
👍 0
🔁 0
💬 1
📌 0
On its own, scrapping the two-child limit would lift around 300k children out of relative poverty.
But 140k kids are already impacted by the two-child limit and the benefit cap
So pairing up with a protected minimum floor would overall reduce child poverty by 500k in 2029/30
29.09.2025 10:28 —
👍 1
🔁 0
💬 2
📌 0
The average couple with kids is projected to lose £750 a year (1.3%) over the parliament. These two changes would reduce that by a third
Lone parent families would be even better supported. Rather than losing 3.0% of income (£780) they would instead be £320 a year better off
29.09.2025 10:28 —
👍 0
🔁 0
💬 1
📌 0

In new @jrf-uk.bsky.social analysis with @katieschmuecker.bsky.social we show how cost-effective improvements to social security can quickly improve the living standards outlook for families
Scrapping the two-child limit and creating an income floor in Universal Credit would make a real difference
29.09.2025 10:28 —
👍 1
🔁 1
💬 1
📌 2

A decade of falling incomes? JRF's pre-budget assessment of living standards
Average incomes are expected to fall by £550 over this parliament, meaning the Government risks having the worst living standards performance of any parliament on record.
But these projections can also be downgraded
As my colleague Chris Belfield has pointed out on the other place, lower productivity growth will make us poorer
For the full write-up of the analysis from Chris, @statspeter.bsky.social, and myself see the link below
www.jrf.org.uk/cost-of-livi...
27.09.2025 08:28 —
👍 0
🔁 0
💬 0
📌 0
Our estimates of living standards are based on the latest OBR and BoE projections for the economy. This data can and will change over the parliament as the economic and policy landscape changes
The more Government does now to improve incomes the better the outlook will be
27.09.2025 08:28 —
👍 0
🔁 0
💬 1
📌 0

Working-age households will fare worse than pensioners, driven in part by very different experiences of social security
Where over 65s will receive £270 more from social security, households headed by someone aged 35 - 64 will receive £150 less. For U35s the loss is £240
27.09.2025 08:28 —
👍 0
🔁 0
💬 1
📌 0

We project that the average real disposable income will be 1.3% (£550) lower in September 2029 than in 2024
Low-income households are set to lose the greatest proportion of their income - 2.7% lower than in 2024, leaving their income 6.2% (£1,110) lower than in 2019
27.09.2025 08:28 —
👍 0
🔁 0
💬 1
📌 0

Analysis from @jrf-uk.bsky.social this week suggests this could be the worst parliament for living standards since detailed records began
This doesn't have to be the case, but clearly more needs to be done to boost household incomes and ensure every family can afford the essentials
27.09.2025 08:28 —
👍 0
🔁 0
💬 1
📌 0
Delighted to give evidence to Work and Pensions Committee on pensioner poverty. Report says "retirement should be dignified and not a struggle at the poverty line." @jrf-uk.bsky.social and @crsp-uk.bsky.social's Minimum Income Standard measures this. What do the stats show? It's not good news (1/4).
24.07.2025 17:01 —
👍 31
🔁 15
💬 1
📌 2
Over 1.6m children are now impacted by the Two-Child Limit - 11.6% of all children
This is a cruel policy that unnecessarily drags children into deeper levels of hardship
It needs to go, and the longer it is kept, the greater the scarring effects on children's health and education will be
10.07.2025 10:45 —
👍 37
🔁 25
💬 0
📌 2
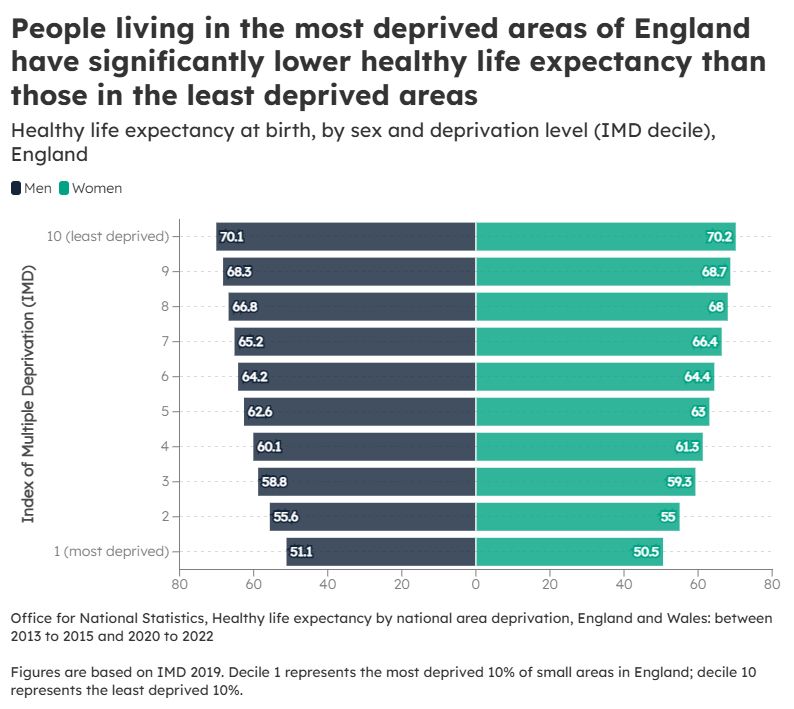
Bar chart titled "Healthy life expectancy at birth, by sex and deprivation level (IMD decile), England". The chart compares healthy life expectancy for men (dark blue bars) and women (light green bars) across ten deprivation deciles, from most deprived (Decile 1) to least deprived (Decile 10), based on the Index of Multiple Deprivation (IMD).
In Decile 1 (most deprived), healthy life expectancy is approximately 51.1 years for men and 50.5 years for women.
In Decile 10 (least deprived), it rises to about 70.1 years for men and 70.2 years for women.
The chart shows a clear upward trend in healthy life expectancy as deprivation decreases, with a nearly 20-year gap between the most and least deprived groups.
Source: Office for National Statistics (ONS), 2020–2022 data.
04.07.2025 11:06 —
👍 11
🔁 10
💬 2
📌 2
The Govt has not published an employment impact assessment for their disability benefit cuts & increased employment support
📣New @jrf-uk.bsky.social analysis shows where you live matters, with competition for jobs higher in some areas with higher claims: former industrial & coastal areas 1/5
24.06.2025 12:53 —
👍 26
🔁 18
💬 2
📌 3


