🌍 ¿Están en peligro nuestras #castañas por el #cambioclimático?
El castaño (Castanea sativa), símbolo de nuestros bosques, podría perder hasta un 65% de su área idónea en escenarios pesimistas por aumento de temperatura y menor humedad. #dataviz #rstats
17.11.2025 10:10 — 👍 109 🔁 57 💬 5 📌 7

#30DayMapChallenge Day 11: Minimal Map
Showing river network from HydroRIVERS clipped to EU countries and Switzerland.
12.11.2025 16:50 — 👍 5 🔁 0 💬 0 📌 0
#30DayMapChallenge Day 10: Air
🌪️ Animated mesh layers of #hurricane tracks resembling Vincent van Gogh’s Starry Night.
#HurricaneMelissa #Jamaica.
Made with #QGIS. Data from #Copernicus #ECMWF
10.11.2025 20:00 — 👍 14 🔁 6 💬 1 📌 0
#COP30 kicks off in Brazil.
Safe bet we'll see this:
✈️ Leaders flying in on private jets - no surprises there
👚 People from wealthy countries suddenly wearing tropical prints and boho outfits they’d never wear back home.
Nothing says climate action like linen shirts and private jets.
11.11.2025 07:29 — 👍 2 🔁 0 💬 1 📌 0

#30DayMapChallenge 10 Nov – Air
Graph showing race-day accumulated precipitation at the Interlagos Circuit (Brazil GP) from 1990 to 2024, together with the inferred likelihood of using slick, intermediate, or wet tyres during the race 🌧🏎️
#F1 #BrazilGP #DataViz #Python
10.11.2025 12:16 — 👍 4 🔁 1 💬 0 📌 0

Static Version
07.11.2025 11:02 — 👍 1 🔁 0 💬 0 📌 0

#30DayMapChallenge 7 Nov - Accessibility
This map shows the weather stations operated by the Spanish Met Service and regions where there is a lack of stations.
𝗧𝗵𝗲 𝗹𝗮𝗰𝗸 𝗼𝗳 𝘄𝗲𝗮𝘁𝗵𝗲𝗿 𝘀𝘁𝗮𝘁𝗶𝗼𝗻 𝗰𝗼𝘃𝗲𝗿𝗮𝗴𝗲 𝗹𝗶𝗺𝗶𝘁𝘀 𝘁𝗵𝗲 𝗮𝗯𝗶𝗹𝗶𝘁𝘆 𝘁𝗼 𝗱𝗲𝘁𝗲𝗰𝘁 𝗮𝗻𝗱 𝗮𝗻𝘁𝗶𝗰𝗶𝗽𝗮𝘁𝗲 𝗲𝘅𝘁𝗿𝗲𝗺𝗲 𝗲𝘃𝗲𝗻𝘁𝘀.
#aemet #geopandas #cartopy
07.11.2025 08:57 — 👍 18 🔁 4 💬 0 📌 0
𝟲𝘁𝗵 𝗡𝗼𝘃𝗲𝗺𝗯𝗲𝗿 𝟮𝟬𝟮𝟱 — 𝗗𝗶𝗺𝗲𝗻𝘀𝗶𝗼𝗻𝘀 3D bubbles showing Arctic sea ice loss VS CO2 rise
🔴 CO2 concentration from Mauna Loa
🔵 Arctic sea ice extent from Copernicus Marine Service
#30DayMapChallenge #python #pyvista #co2 #seaice #climatechange
06.11.2025 21:09 — 👍 7 🔁 1 💬 1 📌 0
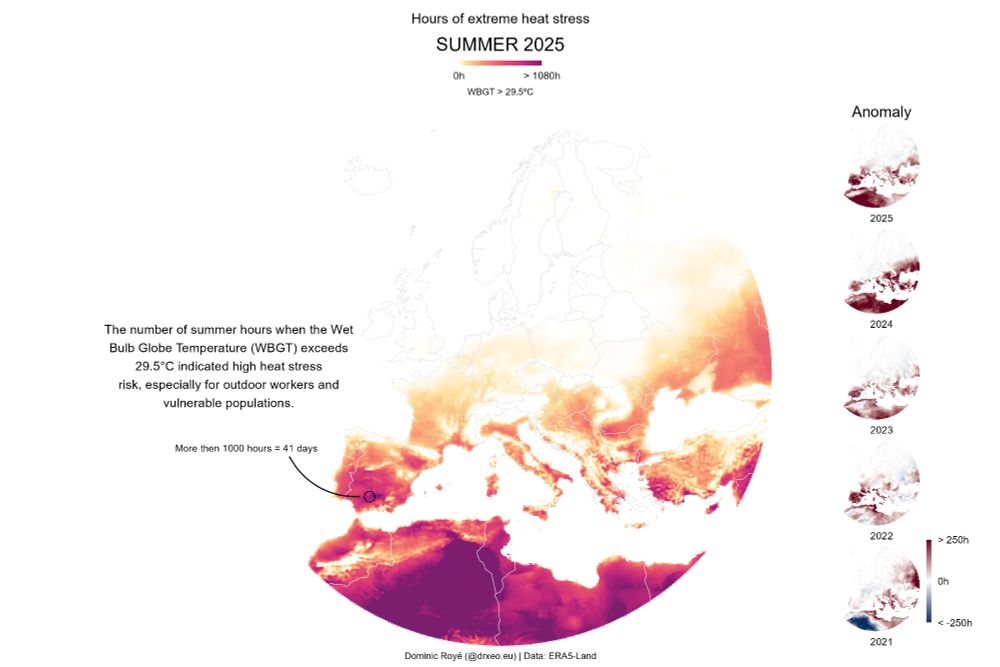
New #dataviz on heat stress in Europe, summer 2025.
This map shows total summer hours with WBGT > 29.5°C — a threshold for extreme heat stress. In parts of Spain, values exceed 1,000 hours (41 days).
#rstats #climatechange #health
03.11.2025 09:48 — 👍 34 🔁 9 💬 0 📌 0

The focus of the image is a portion of LDN 1641, an interstellar nebula in the constellation of Orion. In this view, a deep-black background is sprinkled with a multitude of dots (stars) of different sizes and shades of bright white. Across the sea of stars, a web of fuzzy tendrils and ribbons in varying shades of orange and brown rises from the bottom of the image towards the top-right like thin coils of smoke.
📷 This shimmering view from the ESA Euclid mission shows the dark cloud LDN 1641. Though nearly invisible to the human eye, Euclid’s infrared vision uncovers a rich landscape of gas, dust and dozens of newborn stars🧪🔭
www.esa.int/ESA_Multimed...
@science.esa.int @ec-euclid.bsky.social
05.11.2025 15:53 — 👍 493 🔁 94 💬 5 📌 2

Las políticas actuales encaminan al Planeta a un calentamiento de 2,8ºC este siglo, alerta la ONU
El ritmo actual de las emisiones de gases y las políticas vigentes encaminan al planeta a un calentamiento de 2,8 ºC este siglo, según una revisión de los planes
El ritmo actual de las emisiones de gases y las políticas vigentes encaminan al planeta a un #calentamiento de 2,8 ºC este siglo, según una revisión de los planes nacionales de #acciónclimática efectuada por el Programa de las Naciones Unidas para el Medio Ambiente (PNUMA).
04.11.2025 16:41 — 👍 3 🔁 3 💬 0 📌 0

Day three of the #30DayMapChallenge - Polygons. This map shows the earths tectonic plates. I have overlayed all of the earthquakes with a magnitude greater than 4.0 over the last 20 years, coloured according to their magnitude (blue (smallest) - red (largest).
03.11.2025 21:47 — 👍 51 🔁 15 💬 3 📌 1

𝟯𝗿𝗱 𝗡𝗼𝘃𝗲𝗺𝗯𝗲𝗿: 𝗣𝗼𝗹𝘆𝗴𝗼𝗻𝘀 – showing the economic losses and fatalities caused by weather-related extreme events (1980–2022) across Europe
#30DayMapChallenge2025 #dataviz #geospatial #climate #Python #plotly
03.11.2025 09:28 — 👍 8 🔁 1 💬 0 📌 0

𝟮𝗻𝗱 𝗡𝗼𝘃𝗲𝗺𝗯𝗲𝗿: 𝗟𝗶𝗻𝗲𝘀 - showing coloured 10 m wind, together with streamlines representing flow speed and direction
#30DayMapChallenge2025 #dataviz #geospatial #climate #Python #Cartopy
02.11.2025 21:28 — 👍 11 🔁 0 💬 0 📌 0

First time joining the #30DayMapChallenge — and yes, I’m already late 😅
𝟭𝘀𝘁 𝗡𝗼𝘃𝗲𝗺𝗯𝗲𝗿: 𝗣𝗼𝗶𝗻𝘁𝘀 - showing the main reservoirs of Spain, represented as dots and coloured by their river basin 💧
#30DayMapChallenge2025 #dataviz #geospatial #climate #Python #Cartopy #GeoPandas
02.11.2025 13:55 — 👍 13 🔁 0 💬 0 📌 0


Tenemos el placer en publicar la segunda circular del próximo XIV Congreso AEC que se celebrará entre el 28 y el 30 de octubre de 2026 en La Laguna, Tenerife.
Reservad fechas, esperamos veros todos con ilusión en Tenerife en 2026. 🥳
ℹ️https://shorturl.at/11011
#XIVCongresoAEC #clima #cambioclimatico
01.10.2025 13:55 — 👍 5 🔁 5 💬 0 📌 0
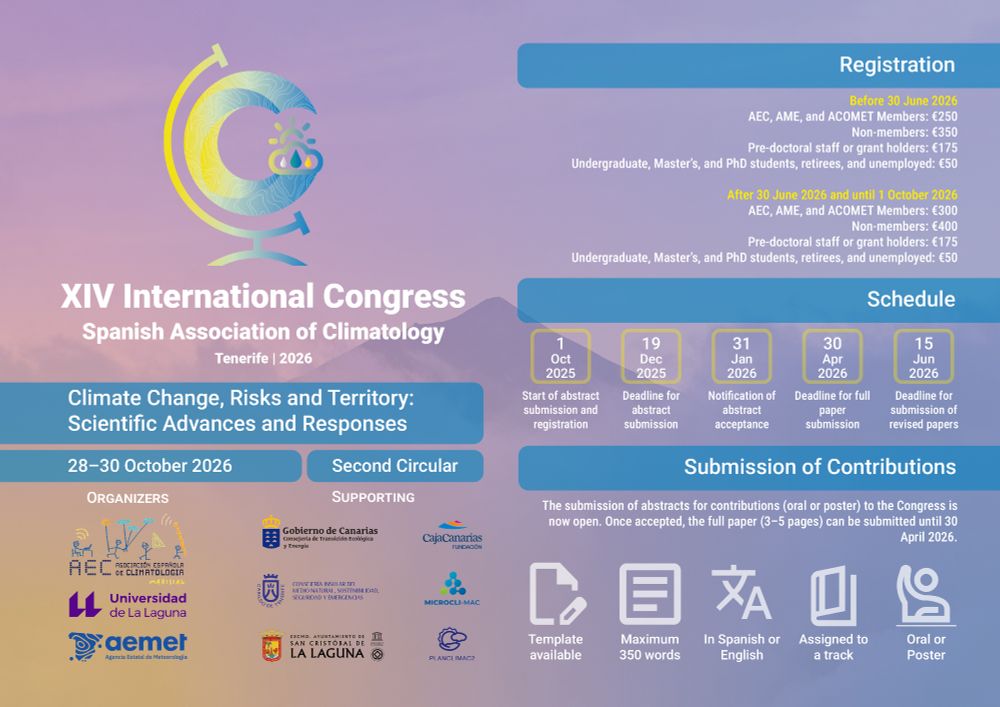

📢 We’re excited to share the second circular for the upcoming 14th AEC Congress, taking place from October 28–30, 2026 in La Laguna, Tenerife.
📅 Save the dates — we can’t wait to see you all in Tenerife! 🥳
ℹ️ shorturl.at/11011
#XIVCongresoAEC #climate #climatechange
01.10.2025 14:06 — 👍 4 🔁 4 💬 0 📌 0

Empezamos el Curso de #comunicación para profesional científico 🗣️ en la @unisevilla.bsky.social impartido por @andreaarnal.bsky.social @angelajustamente.bsky.social y @vcoutoantelo.bsky.social
#clima #meteo #medioambiente
18.09.2025 09:23 — 👍 10 🔁 5 💬 0 📌 2


Wildfires in north west Spain are over 100 km away, yet my hometown's sky is grey and heavy with PM10, PM2.5, and SO₂ according to regional met service.
Breathing feels like smoking.
But hey, climate change isn’t real, right? Just another totally normal summer
#wildfires #climatechange
15.08.2025 17:31 — 👍 0 🔁 0 💬 0 📌 0
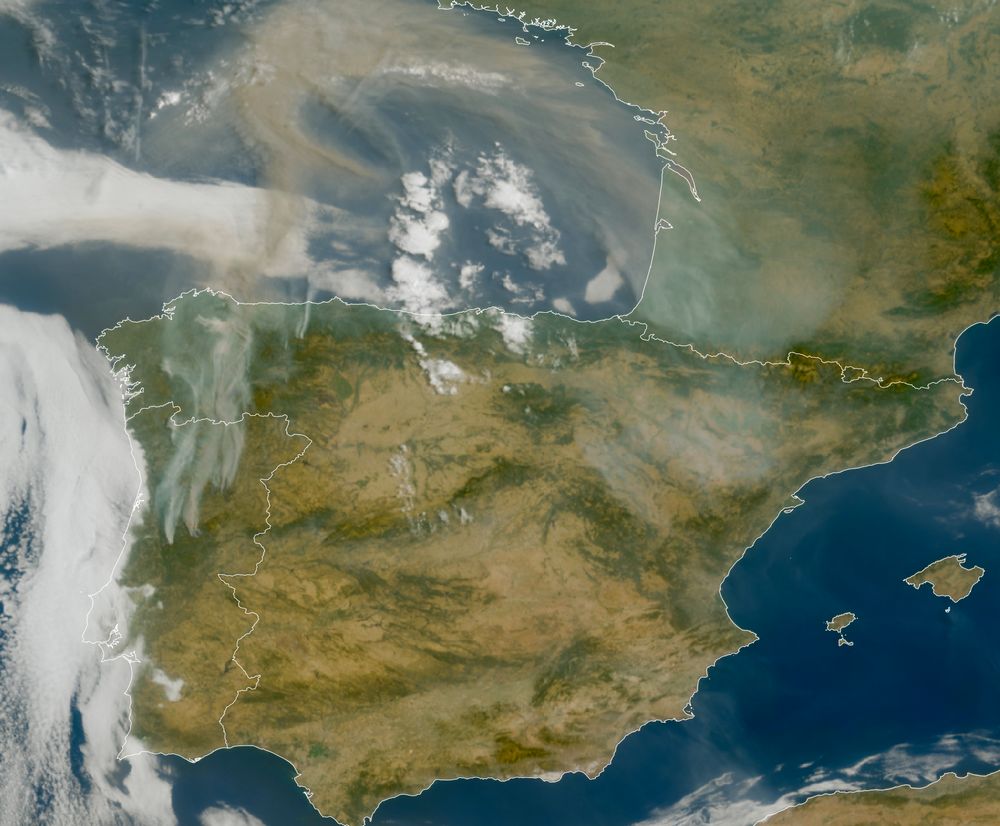
🔴⚠️🔥🇪🇸🇵🇹🌡Alarming conditions for several #wildfires affecting Spain and Portugal since days.The latest meteosat-12 📸 in early August 15 shows a giant smoke plume flying over France as well as violent fires in the iberian peninsula. #climateemergency
15.08.2025 13:23 — 👍 80 🔁 51 💬 7 📌 0
I'm team A too — love how the purple to oranges pop without making the map feel too busy. Has that clean journalistic vibe 🖼️🖼️
05.08.2025 08:41 — 👍 2 🔁 0 💬 0 📌 0
Love it! 👌
04.08.2025 08:15 — 👍 1 🔁 0 💬 0 📌 0
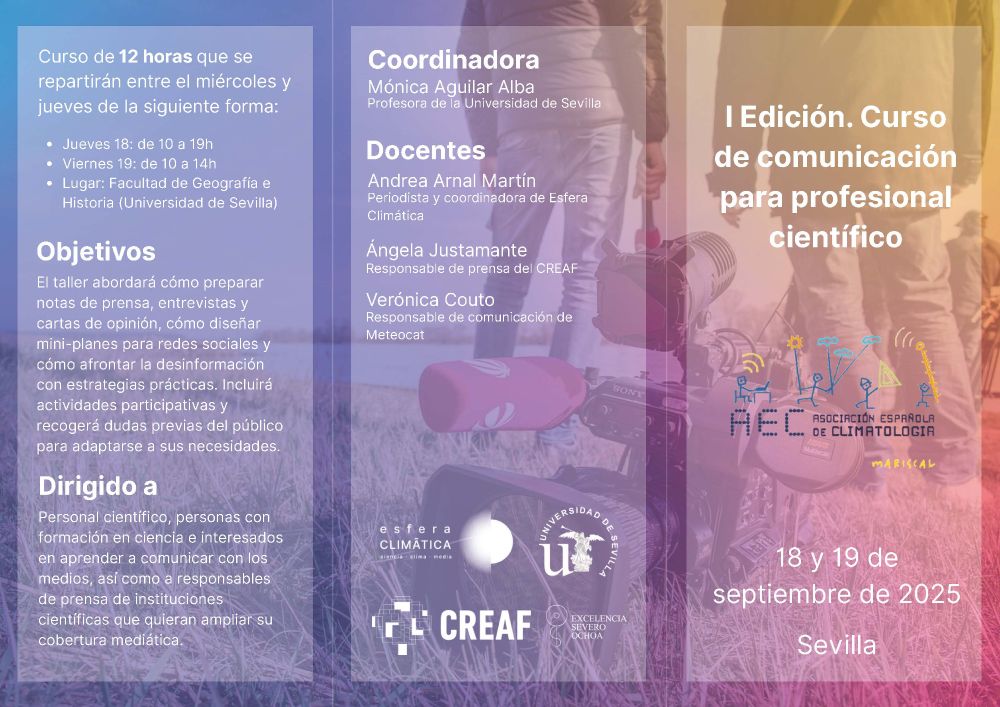
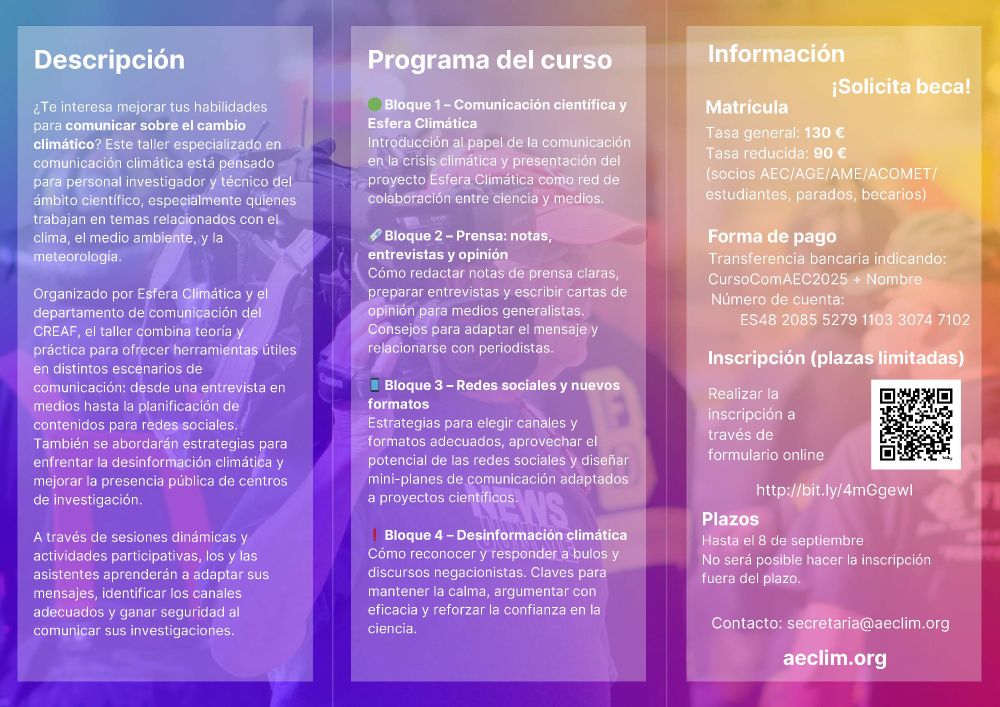
📢 ¿Trabajas en ciencia del clima o áreas afines?
La @aeclim.org organiza en Sevilla el Curso de comunicación para profesionales científicos
🗓️ 18-19 septiembre 2025
📝 Inscripción hasta el 8 de septiembre
📎 +info en el tríptico adjunto
¡Difunde y participa!
28.07.2025 15:41 — 👍 3 🔁 2 💬 0 📌 0
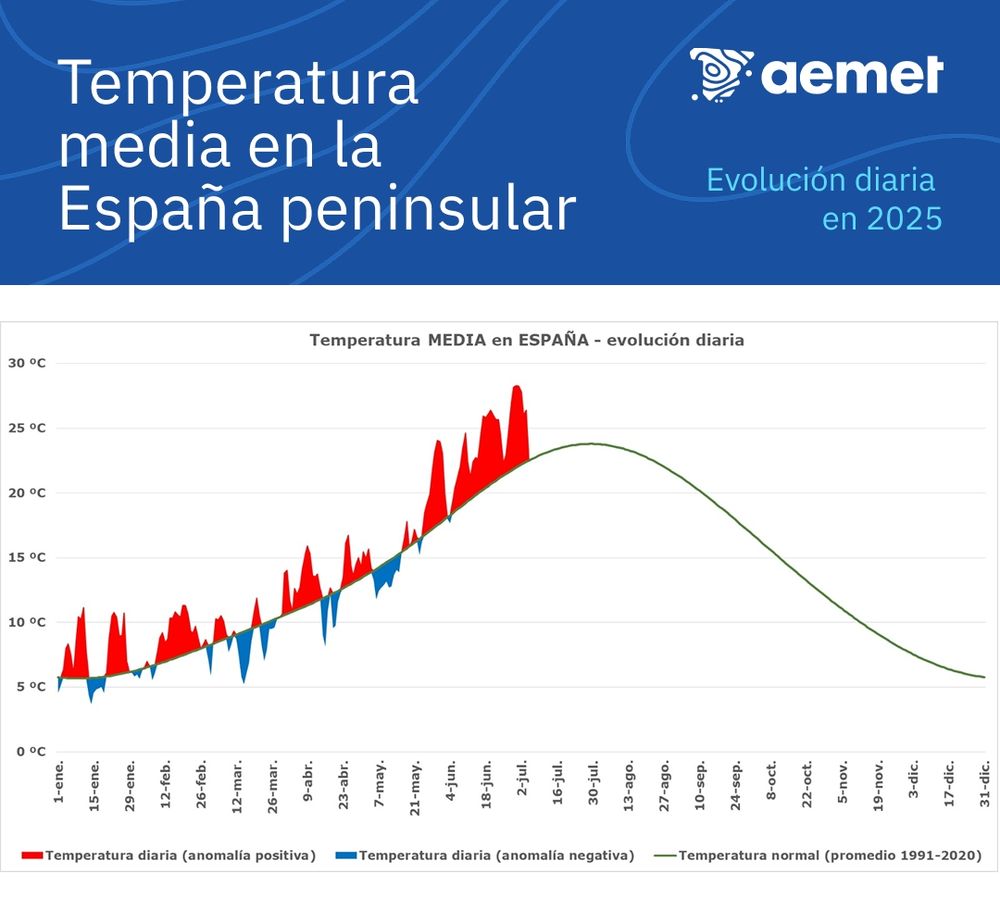
🗣 "Siempre ha hecho calor en verano".
Sí, pero no hay precedentes de un junio tan cálido como el actual. No hay más que ver la gráfica de anomalías.
Y no es un caso aislado: entre 2022 y 2024 hubo 7 récords de meses calidos. El último récord de mes frío fue febrero de 2005.
25.06.2025 19:16 — 👍 1148 🔁 832 💬 18 📌 43
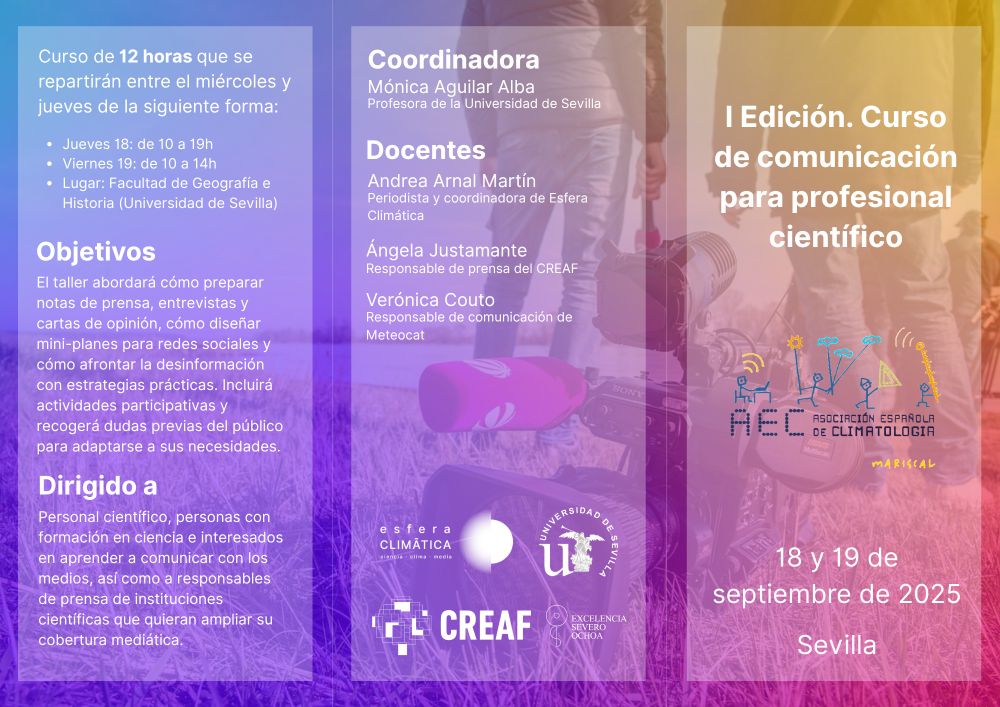
Tenemos el placer en anunciar un nuevo curso organizado por la AEC con el @creaf.cat titulado "Curso de comunicación para profesional científico" 🗣️ que tendrá lugar entre el 18 y 19 de septiembre de 2025 en Sevilla. 🌤️ ⛈️
Encontráis toda la información en el tríptico. 👇
@unisevilla.bsky.social
12.06.2025 10:32 — 👍 12 🔁 7 💬 0 📌 2

Rueda mantén durante meses un conselleiro acusado de agresión sexual para despedilo cunha aperta.
O nome da vítima aparece en TODOS os medios de comunicación.
Temos o país que votamos. Vergoña.
08.06.2025 08:58 — 👍 6 🔁 2 💬 0 📌 0
👌👌👏👏👏
30.05.2025 17:27 — 👍 0 🔁 0 💬 0 📌 0


📢 VII EDICIÓN. Introducción en Sistemas de Información Geográfica y Cartografía con el entorno R 🗺️
📆 1 al 4 de julio de 2025
🖋️ Inscripción abierta
❗Plazas limitadas❗Anímate 🥳
#geografía
#sig
#dataviz
21.04.2025 13:41 — 👍 6 🔁 8 💬 0 📌 1

El 17 de mayo se celebra el día internacional contra la LGTBIfobia.
Desde #GeocienciasArcoíris os presentaremos durante los próximos días referentes históricos y actuales en Geociencias que entonces se hubieran considerado personas enfermas🏳️🌈⚧️🏳️⚧️
igeo.ucm-csic.es/comision-de-...
14.05.2025 06:40 — 👍 37 🔁 16 💬 1 📌 1
Population Geographer | Spatial Demographer.
Partial to words like orthogonal + heterodox.
Also very partial to shoes.
rachelfranklin.org + rachelfranklin.substack.com
Data Visualization. Ex-Planet & NASA Earth Observatory. Blue Marble, Earth at Night, color, cartography, occasionally skewed views of Earth. Looking for a job.
💼 Visual projects @theguardian.com https://www.theguardian.com/profile/ana-lucia-gonzalez-paz
🗺️ Maps shape you https://a-map-inside.webflow.io/
And more https://linktr.ee/analuciagonzalez
Hecha en 🇨🇴, formerly BBC
I paint the world with #rstats and teach you how to unleash your inner #map artist. Join my map adventures and tutorials now:
https://youtube.com/@milos-makes-maps
Mapping the world with Python. Geospatial data scientist who likes maps.
Contact adam@pythonmaps.com
climate scientist
posts 100% my own
🇨🇦 is my home
distinguished professor & chair, Texas Tech
chief scientist, The Nature Conservancy
board member, Smithsonian NMNH
alum, UToronto and UIUC
author, Saving Us
#ClimateHealth #Biometeorology #ClimateChange #Biometeorología #CambioClimático #SaludYMeteo
We are dedicated to fostering community for data visualization professionals.
Climate Data Visualiser @copernicusecmwf.bsky.social 🛰️ 📈🌍🌡️🎨 • @datavizsociety.bsky.social DVS mentor 2025 • Previously physicist @cambridgephysics.bsky.social 🔬 & data journalist @thetimes.com 🗞️ • 🇮🇹 + 🇬🇧 • Views mine
BSC-CNS (Barcelona Supercomputing Center-Centro Nacional de Supercomputación) is the National Supercomputing Facility in Spain.
www.bsc.es
Official daily update on atmospheric CO2 levels in the post-400 ppm era from Scripps Institution of Oceanography's iconic Keeling Curve.
ClimaMeter is a rapid framework for understanding extreme weather events in a changing climate based on looking at similar past weather situations. Follow our study on https://www.climameter.org
Physicist working on Climate | Copernicus @ecmwf | data, society and decisions | services. Opinions are my own.
The #CopernicusClimate Change Service (#C3S) & #CopernicusAtmosphere Monitoring Service (CAMS), implemented by @ecmwf.int on behalf of the European Commission.
A monthly journal dedicated to publishing cutting-edge research on the nature, underlying causes or impacts of global climate change and its implications for the economy, policy and the world at large https://www.nature.com/nclimate
#50YearsOfESA: we're the European Space Agency, keeping you posted on European space activities.
Please see our Privacy Notice: https://esa.int/connectwithus
Rapid attribution to uncover the influence of climate change on heatwaves, drought, wildfire, storms and floods.