Microsoft: “We’re retiring Azure Data Studio, use Polyglot Notebooks”
Also Microsoft just now: “just kidding, we’re deprecating Polyglot Notebooks”
I guess if it doesn’t have “Copilot” in the name, you can kiss it goodbye…
11.02.2026 19:55 — 👍 5 🔁 0 💬 1 📌 0


What I’ve been up to lately — tackling an exciting, challenging, thrilling, exhausting new adventure.
12.11.2025 17:22 — 👍 1 🔁 0 💬 0 📌 0
August 6, 1992 looks like. Oakland vs Texas
11.06.2025 15:54 — 👍 0 🔁 0 💬 0 📌 0
Guess it's time for a new laptop then. Darn 😃
11.06.2025 10:01 — 👍 1 🔁 0 💬 0 📌 0
That sounds way more efficient than what I did. I actually struggled a lot with the size - working on a 10-year-old 16gb RAM thinkpad but with only like 3gb free on the hard drive.
Duckdb kept spilling to disk and then I'd get "out of memory" errors. At least I think that's what was happening
11.06.2025 02:46 — 👍 0 🔁 0 💬 1 📌 0
These are amazing. I'm guessing I missed then because I specified only "verb" part of speech when lemmatizing?
11.06.2025 02:41 — 👍 0 🔁 0 💬 1 📌 0
This was my first time using Github Copilot. I had a pretty good idea of the approach I wanted to take so I was mainly leaning on it for fleshing out the syntax. I found myself correcting quite a bit of the SQL it wrote, but overall I was very impressed!
10.06.2025 01:47 — 👍 3 🔁 0 💬 0 📌 0
The results:
• Tom Browning (present participle) vs. John, Michael, and Jarvis Brown (36 PA in the 1980s)
• Barret Browning vs. Dominic Brown (2 PA in 2012)
• Kelly Downs vs. Brian Downing (3 PA in 1992)
• Jace Fry vs. Max Fried (1 PA in 2019)
And that's it! Open to any challenges or corrections.
07.06.2025 13:23 — 👍 3 🔁 0 💬 2 📌 0
My process and tools:
• Retrosheet's full parsed play-by-play dataset (~15M records, ~200K games)
• DuckDb to load .csv and generate unique batter/pitcher name combos
• NLTK to apply verb lemmatization, keeping only the pairs with matching lemma
• Claude 3.5 + GH Copilot + vibes
07.06.2025 13:23 — 👍 0 🔁 0 💬 1 📌 0

A Redditor poses a fun baseball data challenge. I attempt to vibe-code my way to *an* answer ⬇ #dataBS
07.06.2025 13:23 — 👍 8 🔁 0 💬 1 📌 0
Shame on me for using a janky workaround…but at the same time it’s worked for ~5 years this way with no issues. I feel like I might’ve learned it from BIElite back in the day.
And no warning that I saw (although I very well could have missed something)
24.02.2025 14:19 — 👍 1 🔁 0 💬 1 📌 0

How my Monday started:
“ Measures” (leading space) is evidently no longer a supported table name, as of 2.140.1078.0, preventing us from opening models in Desktop.
24.02.2025 12:10 — 👍 3 🔁 2 💬 1 📌 0
Hey @powerbi.bsky.social, with the Power BI community site in “read-only” mode today, is there an alternative place for us to submit bugs/issues in the meantime? #PowerBI
Cc @jaypowerbi.bsky.social
24.02.2025 12:08 — 👍 3 🔁 0 💬 1 📌 0
Folks who manage large #PowerBI models with incremental refresh, how do you handle “static” start dates for archived data (ex keep everything 2016-present)?
Set rolling window periods to some arbitrarily large value? Manually increment rolling window periods each year? Some other way?
08.01.2025 02:34 — 👍 1 🔁 1 💬 0 📌 0
The release cadence seems to have slowed considerably. Unsure if that’s related
04.12.2024 21:49 — 👍 0 🔁 0 💬 1 📌 0
I agree, but also “not everything that counts can be counted, and not everything that can be counted counts”.
Aren’t there some things that we should do just because they make sense, even if we have no idea how or whether we’ll be able to directly measure their impact?
03.12.2024 20:00 — 👍 0 🔁 0 💬 1 📌 0
Thanks for highlighting this book. Binge-listened (read?) it over the long weekend, inspired by this post. Really eye-opening perspective.
02.12.2024 02:52 — 👍 1 🔁 0 💬 1 📌 0

A picture of a Roman column, showing layers of exposed brick and stucco
A lot of Roman era columns were as well, I think.
Took this photo in Pompeii last month.
01.12.2024 17:24 — 👍 2 🔁 0 💬 0 📌 0
Not natively, but there is a “workaround”. Although evidently it’s been having some issues as of late.
bsky.app/profile/josh...
30.11.2024 04:34 — 👍 2 🔁 0 💬 2 📌 0
"In the last analysis, every profession is a conspiracy against the laity"
- George Bernard Shaw
28.10.2024 21:47 — 👍 5 🔁 0 💬 0 📌 0
The common "solution" is just to save a copy of the dashboard as a pdf each month lol. Full circle
28.10.2024 21:40 — 👍 2 🔁 0 💬 1 📌 0
There are several of us here!
28.10.2024 13:00 — 👍 0 🔁 0 💬 1 📌 0
Excited about the revival of a community here. Data Twitter was the tech mentor I was missing during my career change.
Can't help feeling tho that the dissolution was only partially due to the changes over there...feels like there was also a massive (downward) vibe shift in the field that coincided
28.10.2024 03:18 — 👍 12 🔁 0 💬 3 📌 0

Been fine-tuning an Excel model over the last few years to compare health insurance options for my wife and me - breakeven points, cost splits, the works. Had Claude double-check my math this year - it recreated everything as a working React component in about 35 seconds
27.10.2024 15:36 — 👍 4 🔁 0 💬 0 📌 0
The shop I work in is hiring a data person (Power BI, Tableau, etc), if anyone is searching for a (US-based) jerb. Management is good and the gig is fully remote. Let me know if you have any questions.
https://jobs.uwm.edu/postings/39578
#PowerBI #Tableau #SQL #GetFedihired
26.10.2024 21:29 — 👍 2 🔁 2 💬 0 📌 0
luna moth - Actias luna (Linnaeus)
At first I thought maybe a tomato worm, but Copilot says "luna moth caterpillar", which looks correct.
entnemdept.ufl.edu/creatures/mi...
09.09.2024 02:15 — 👍 1 🔁 0 💬 0 📌 0
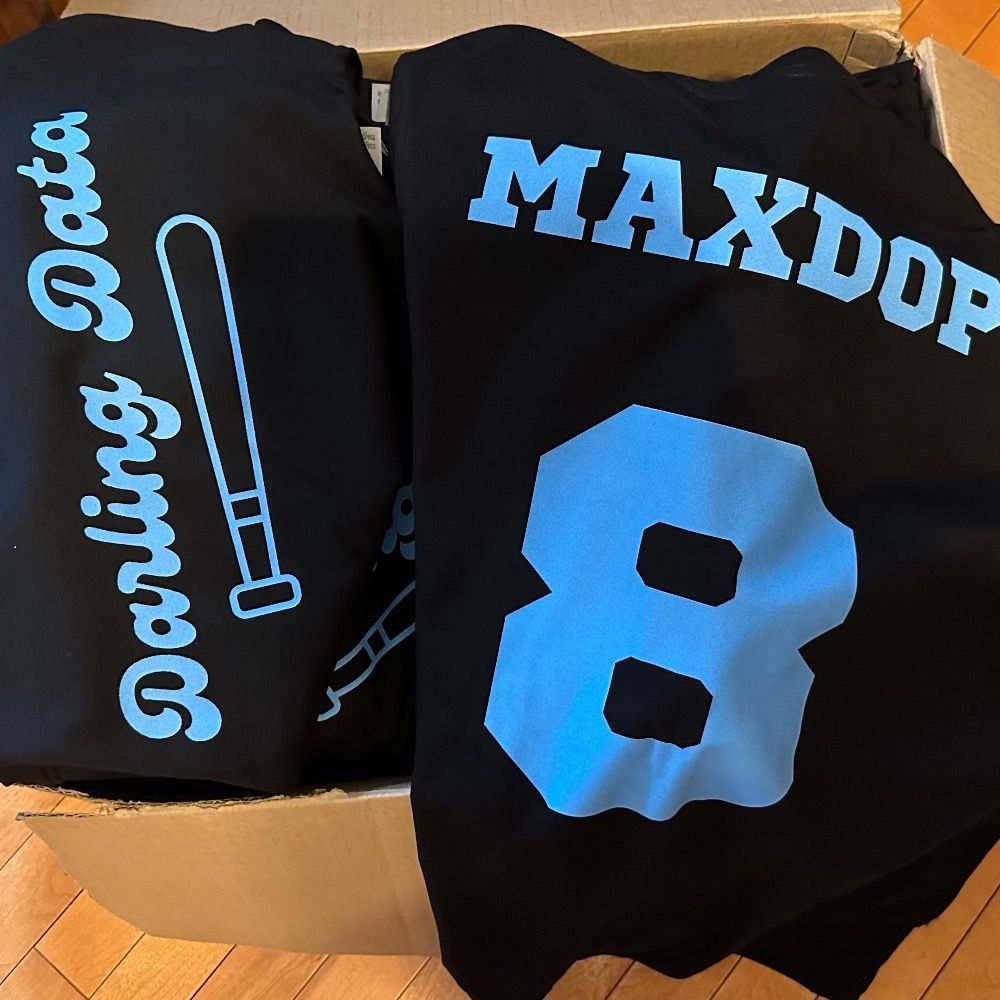
I will make your #SQLServer faster in exchange for money.
https://linktr.ee/darlingdata
Demographics | Geospatial | Data Science | Open Source
Posit DS Hangout host & data educator. Data Weasel. Community Builder. Teaches R+Python.
🔉 Heeren == "hair-en" ✨
LinkedIn: https://www.linkedin.com/in/libbyheeren
DS Hangout: https://pos.it/dsh
technologist, philosopher, and outdoors enthusiast
CTO@COGINITI
What is this Bluesky thing?
Ph.D, stats lover/writer✍🏼, #statistics #scicomm #datascience #statstiktok 👩🏻💻 she/her
Product person, recently ex-Microsoft. Dev experiences, Al, data. Helper of experts. She/Her. Black Lives Matter.
This meeting could have been a riot.
Whoa, everything's computer!
Data Person
PM @ Tabular Editor
Data analytics engineer #SQL #DataModeling #Analytics #BigQuery #WebAnalytics
zachrenwick.work
scientist, storyteller, philosopher
computingthehumanexperience.com
data engineering for orange apron media
opinions are mine
atlanta, ga
née bluefeet. Crossfitter, runner, pivot lover, wannabe woodworker. Blue badge holder. Ex-Stack Overflow DBRE. Former SQL MVP. Opinions are mine... she/her
Software Engineering and Data Leader @ HubSpot. O’Reilly author. Enjoyer of dogs and video games
Stuff I created:
https://www.amazon.com/dp/1492087831/
https://www.dataliftoff.com
Opinions about product management, technology news and inclusivity in tech. Diversity is about demographics, inclusion is about creating a sense of belonging.
Senior document signer @ Docusign, prev: lead risk manager @ Alameda Research
Power BI front end report design expert at Microsoft. All opinions are my own.
Golf / Power BI / Cats / Music