Graphic which reads 'TDOR 2024'. The scottish trans logo is in the top right corner. At the bottom of the graphic is an illustration of five candles in the trans flag colours.
Today is Trans Day of Remembrance (TDoR), a day where we pause to remember those who we have lost around the world this year as a result of transphobic violence. It continues to be the case that Black trans women, trans women of colour, and trans sex workers are most at risk of murder.
20.11.2024 11:40 — 👍 84 🔁 47 💬 2 📌 2
Speaking the truth as always ✨
19.11.2024 19:08 — 👍 1 🔁 0 💬 0 📌 0
I love this so much! 🍔 I'm feeling inspired to try something like this for The Great North now!
19.11.2024 18:25 — 👍 1 🔁 0 💬 0 📌 0

Time series visualization showing the proportion of questions vs. exclamations in Bob's Burgers dialogue across 14 seasons (2011-2024). Blue lines (questions) consistently trend higher than coral lines (exclamations), ranging 5-20%. Red circles highlight episodes where exclamations exceed questions.
Here is my #viz for the #TidyTuesday challenge—W47. This one is about Bob's Burgers Episodes.
.
🔗: stevenponce.netlify.app/data_visuali...
.
#rstats | #r4ds | #dataviz | #ggplot2
18.11.2024 22:28 — 👍 37 🔁 5 💬 1 📌 0
Here is a comparison between 1990 and 2018.
19.11.2024 09:34 — 👍 15 🔁 4 💬 2 📌 2
I've just created my very first blog with Quarto! 💙
19.11.2024 05:18 — 👍 2 🔁 0 💬 0 📌 0
I've not tried it yet because I'm scared 😭
19.11.2024 00:17 — 👍 1 🔁 0 💬 1 📌 0
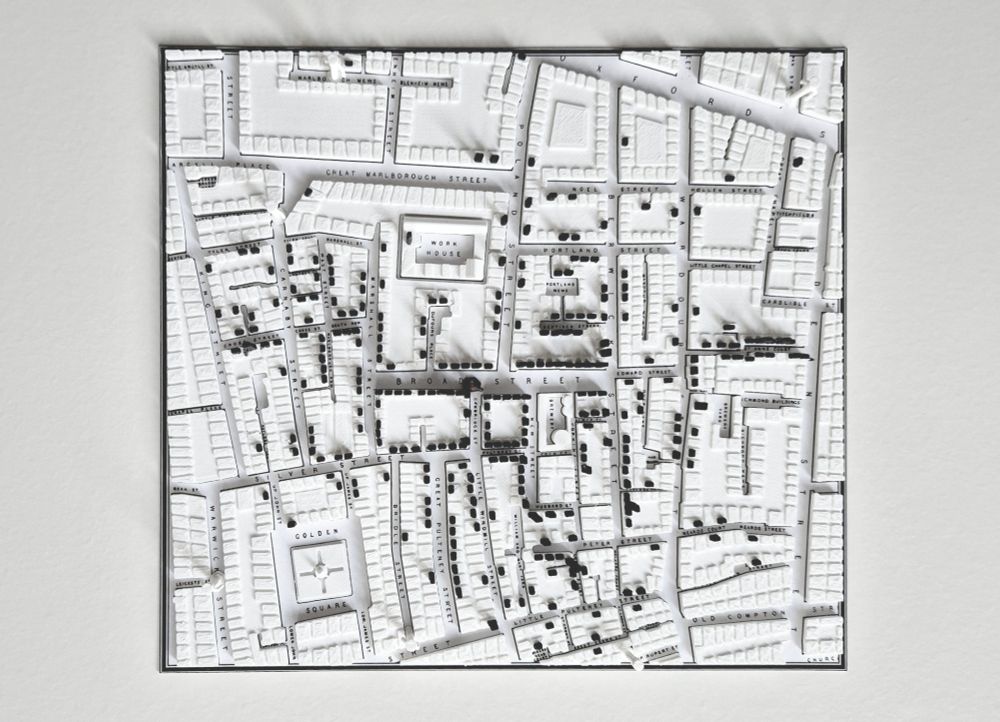
3D-printed map of Soho in 1854. Black marks on top of the buildings represent deaths from cholera caused by infected water from the Broad Street Pump (note the missing handle!). Top-down view.
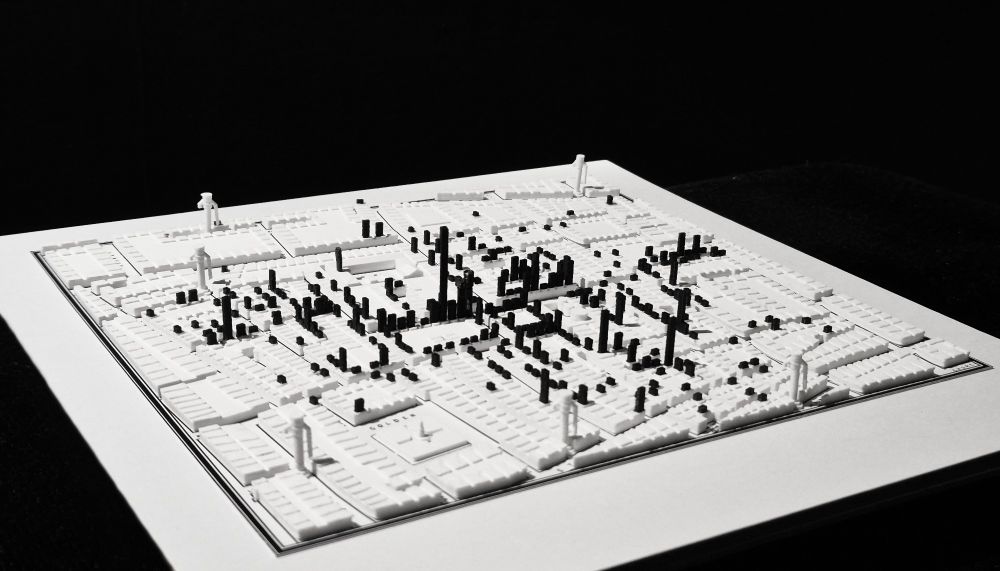
3D-printed map of Soho in 1854. Black marks on top of the buildings represent deaths from cholera caused by infected water from the Broad Street Pump (note the missing handle!). Side view.
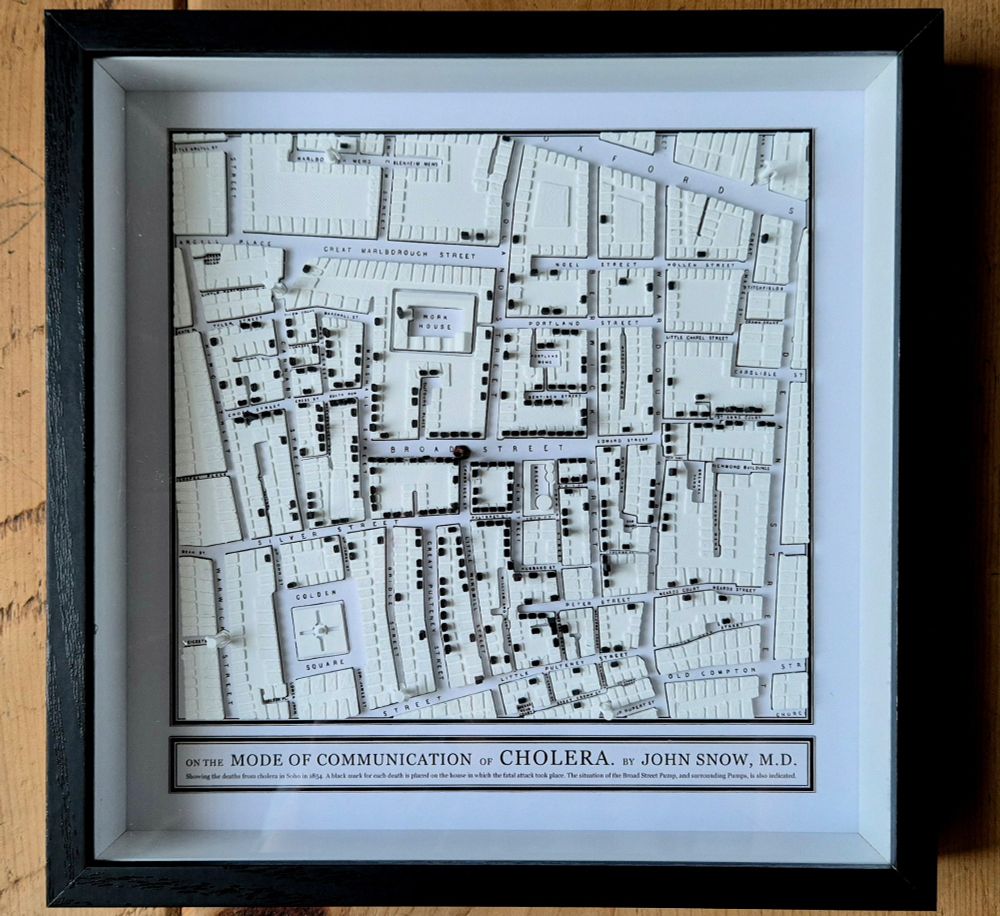
3D-printed map of Soho in 1854. Black marks on top of the buildings represent deaths from cholera caused by infected water from the Broad Street Pump (note the missing handle!). Framed, close-up.
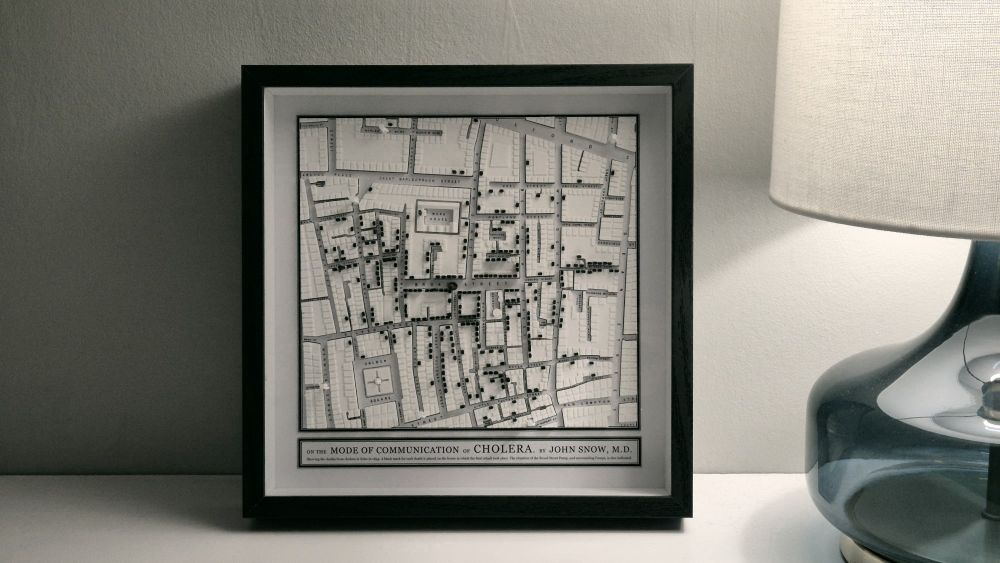
3D-printed map of Soho in 1854. Black marks on top of the buildings represent deaths from cholera caused by infected water from the Broad Street Pump (note the missing handle!). Frame, "artful" shot.
Day 18 #30DayMapChallenge
I 3D-printed John Snow's 1854 cholera map of Soho. It took ages.
18.11.2024 14:28 — 👍 694 🔁 150 💬 35 📌 36
I love this!
18.11.2024 07:50 — 👍 1 🔁 0 💬 1 📌 0
My milquetoast take is that generative AI shouldn't ever be used with data visualisation full stop because hallucinated data is much harder to spot when it's been abstracted into a visualisation.
17.11.2024 11:44 — 👍 299 🔁 52 💬 10 📌 4
Very well deserved 💜🧡
18.11.2024 07:24 — 👍 1 🔁 0 💬 0 📌 0

A faceted bar chart of penguins in the Palmer Archipelago created using the ggplot2 package in R. The plot shows that Gentoo penguins were the most common on Biscoe island, Chinstrap on Dream island and Adelie was the only species of penguin on Torgersen island. We also see that an equal amount of male and female penguins were studied by island, by species and by island by species. Finally the figure shows that Adelie and Gentoo are the only species present on Biscoe, Adelie and Chinstrap are the only species present on Dream and that Adelie is the only species present on Torgersen.
My first ever blog post! In it we introduce plotting with ggplot2 by creating some penguin based bar charts🐧📊
katherinehiggs.com/posts/Visual...
18.11.2024 07:22 — 👍 2 🔁 0 💬 0 📌 0
Trans Millennial from MA/RI🏳️⚧️🌈
☕️🐾🍜🌮🎼♻️🔬🥃
Salem, MA 🖤
https://linktr.ee/blissfully.brooke
🤖 A collection of over 400 open-sourced, free #RStats books. This bot posts a random entry every few hours. Maintained by @oscarbaruffa.com
Teaching materials for the cusy training courses on a Python-based data science workflow: https://cusy.io/en/seminars
Data Visualisation Manager at a health think tank 👩💻 Mostly talk about data, #dataviz, #opendata, #maps, #python and #data4good 📈 Into cycling, yoga, sourdough, puns and more. Views my own.
Also active on Mastodon + Linkedin
Science Communicator • Videos for Scientific American • co-host of “Let’s Learn Everything!” on Maximum Fun • he/him
See my live science game show!
www.OurFindingsShow.com
www.TomLum.com
Cosmologist, pilot, author, connoisseur of cosmic catastrophes. TEDFellow, CIFAR Azrieli Global Scholar. Domain verified through my personal astrokatie.com website. She/her. Dr.
Personal account; not speaking for employer or anyone else.
Open-source scientific and technical publishing system brought to you by posit.co.
github.com/quarto-dev/quarto-cli
small sims girl 🌻 | youtube.com/lilsimsie twitch.tv/lilsimsie
Powerpoint by day, #ggplot2 by night. Here for dataviz and #rstats content and rants about football. 📊⚽️
Based in Cologne, Germany.
R, data, 🐕, 🍸, 🌈. He/him.
Dataviz designer, psychiatrist, PhD student
https://karaman.is
🧙♂️✨📊
Independent Data Visualization Designer, Consultant & Instructor | available for projects and workshops
All things data & design with #rstats, #ggplot2, #Figma, #DataWrapper, #Flourish, and more
Co-Founder of the #30DayChartChallenge
Associate Dean of Learning and Teaching @uofglasgow.bsky.social, PFHEA, psychologist, #rstats, learning & teaching in higher education, scholarship focused, in particular student and staff approaches to lecture recordings. 🏳️🌈
📊 Data visualisation specialist.
💻 #RStats | #Python | #D3.
🎨 Generative artist.
🏃♀️ Runner.
Website: https://nrennie.rbind.io/
She/her. Views my own.
Website: https://stevenponce.netlify.app/
GitHub: http://github.com/poncest/
LinkedIn: http://linkedin.com/in/stevenponce/
Assoc Prof Computer Science and Communication Studies at Northwestern. Infovis, HCI. Author of tidybayes & ggdist R pkgs. he/him. 🏳️🌈 https://mjskay.com/
Co-director https://mucollective.northwestern.edu
Co-founder https://journalovi.org
Visualisation and graphics @posit.co
Classic Generative Art Weirdo using 🖤 and R: http://thomaslinpedersen.art and http://deca.art/thomasp85
he/him