𝖳𝗁𝖾 𝖫𝖺𝗇𝖽 𝖯𝗋𝗈𝖽𝗎𝖼𝗍𝗂𝗏𝗂𝗍𝗒 𝖣𝗒𝗇𝖺𝗆𝗂𝖼𝗌 (𝖫𝖯𝖣) 𝗂𝗇𝖽𝗂𝖼𝖺𝗍𝗈𝗋 𝗆𝖾𝖺𝗌𝗎𝗋𝖾𝗌 𝗅𝗈𝗇𝗀-𝗍𝖾𝗋𝗆 𝖼𝗁𝖺𝗇𝗀𝖾𝗌 𝗂𝗇 𝗏𝖾𝗀𝖾𝗍𝖺𝗍𝗂𝗈𝗇 𝗉𝗋𝗈𝖽𝗎𝖼𝗍𝗂𝗏𝗂𝗍𝗒 𝖻𝗒 𝖼𝗈𝗆𝖻𝗂𝗇𝗂𝗇𝗀 𝗍𝗋𝖾𝗇𝖽, 𝗌𝗍𝖺𝗍𝖾, 𝖺𝗇𝖽 𝗉𝖾𝗋𝖿𝗈𝗋𝗆𝖺𝗇𝖼𝖾 𝗅𝖺𝗒𝖾𝗋𝗌 𝖽𝖾𝗋𝗂𝗏𝖾𝖽 𝖿𝗋𝗈𝗆 𝟣𝟧+ 𝗒𝖾𝖺𝗋𝗌 𝗈𝖿 𝗌𝖺𝗍𝖾𝗅𝗅𝗂𝗍𝖾 𝖭𝖣𝖵𝖨 𝖽𝖺𝗍𝖺 (𝟣𝟫𝟪𝟤–𝟤𝟢𝟣𝟥).
𝖫𝖯𝖣 𝗌𝖾𝗋𝗏𝖾𝗌 𝖺𝗌 𝗈𝗇𝖾 𝗈𝖿 𝗍𝗁𝖾 𝖼𝗈𝗋𝖾 𝗀𝗅𝗈𝖻𝖺𝗅 𝗂𝗇𝖽𝗂𝖼𝖺𝗍𝗈𝗋𝗌 𝖿𝗈𝗋 𝖲𝖣𝖦 𝟣𝟧.𝟥 (𝖫𝖺𝗇𝖽 𝖣𝖾𝗀𝗋𝖺𝖽𝖺𝗍𝗂𝗈𝗇 𝖭𝖾𝗎𝗍𝗋𝖺𝗅𝗂𝗍𝗒) 𝗎𝗇𝖽𝖾𝗋 𝗍𝗁𝖾 𝖴𝖭𝖢𝖢𝖣, 𝗁𝖾𝗅𝗉𝗂𝗇𝗀 𝖼𝗈𝗎𝗇𝗍𝗋𝗂𝖾𝗌 𝗍𝗋𝖺𝖼𝗄 𝗐𝗁𝖾𝗋𝖾 𝗅𝖺𝗇𝖽 𝗂𝗌 𝗅𝗈𝗌𝗂𝗇𝗀 𝗈𝗋 𝗀𝖺𝗂𝗇𝗂𝗇𝗀 𝖻𝗂𝗈𝗅𝗈𝗀𝗂𝖼𝖺𝗅 𝗉𝗋𝗈𝖽𝗎𝖼𝗍𝗂𝗏𝗂𝗍𝗒.
𝖴𝗇𝗅𝗂𝗄𝖾 𝗌𝗂𝗇𝗀𝗅𝖾-𝗒𝖾𝖺𝗋 𝗏𝖾𝗀𝖾𝗍𝖺𝗍𝗂𝗈𝗇 𝗂𝗇𝖽𝗂𝖼𝖾𝗌, 𝖫𝖯𝖣 𝗋𝖾𝖿𝗅𝖾𝖼𝗍𝗌 𝗉𝖾𝗋𝗌𝗂𝗌𝗍𝖾𝗇𝗍 𝖾𝖼𝗈𝗌𝗒𝗌𝗍𝖾𝗆 𝗍𝗋𝖾𝗇𝖽𝗌, 𝖽𝗂𝗌𝗍𝗂𝗇𝗀𝗎𝗂𝗌𝗁𝗂𝗇𝗀 𝗍𝖾𝗆𝗉𝗈𝗋𝖺𝗋𝗒 𝖼𝗅𝗂𝗆𝖺𝗍𝗂𝖼 𝖿𝗅𝗎𝖼𝗍𝗎𝖺𝗍𝗂𝗈𝗇𝗌 𝖿𝗋𝗈𝗆 𝗀𝖾𝗇𝗎𝗂𝗇𝖾 𝖽𝖾𝗀𝗋𝖺𝖽𝖺𝗍𝗂𝗈𝗇 𝗈𝗋 𝗋𝖾𝖼𝗈𝗏𝖾𝗋𝗒.
𝖳𝗁𝖾 𝗈𝖻𝗌𝖾𝗋𝗏𝖾𝖽 𝗉𝗋𝗈𝖽𝗎𝖼𝗍𝗂𝗏𝗂𝗍𝗒 𝖽𝖾𝖼𝗅𝗂𝗇𝖾𝗌 𝖺𝗋𝖾 𝗇𝗈𝗍 𝗌𝗂𝗆𝗉𝗅𝗒 𝗏𝖾𝗀𝖾𝗍𝖺𝗍𝗂𝗈𝗇 𝗅𝗈𝗌𝗌𝖾𝗌 𝗍𝗁𝖾𝗒 𝗋𝖾𝗉𝗋𝖾𝗌𝖾𝗇𝗍 𝗋𝖾𝖽𝗎𝖼𝖾𝖽 𝖾𝖼𝗈𝗌𝗒𝗌𝗍𝖾𝗆 𝖾𝖿𝖿𝗂𝖼𝗂𝖾𝗇𝖼𝗒, 𝗐𝗁𝖾𝗋𝖾 𝗌𝗈𝗂𝗅𝗌, 𝗐𝖺𝗍𝖾𝗋 𝖼𝗒𝖼𝗅𝖾𝗌, 𝖺𝗇𝖽 𝗏𝖾𝗀𝖾𝗍𝖺𝗍𝗂𝗈𝗇 𝗂𝗇𝗍𝖾𝗋𝖺𝖼𝗍𝗂𝗈𝗇𝗌 𝗇𝗈 𝗅𝗈𝗇𝗀𝖾𝗋 𝗌𝗎𝗉𝗉𝗈𝗋𝗍 𝖼𝗈𝗇𝗌𝗂𝗌𝗍𝖾𝗇𝗍 𝖻𝗂𝗈𝗆𝖺𝗌𝗌 𝗀𝗋𝗈𝗐𝗍𝗁.
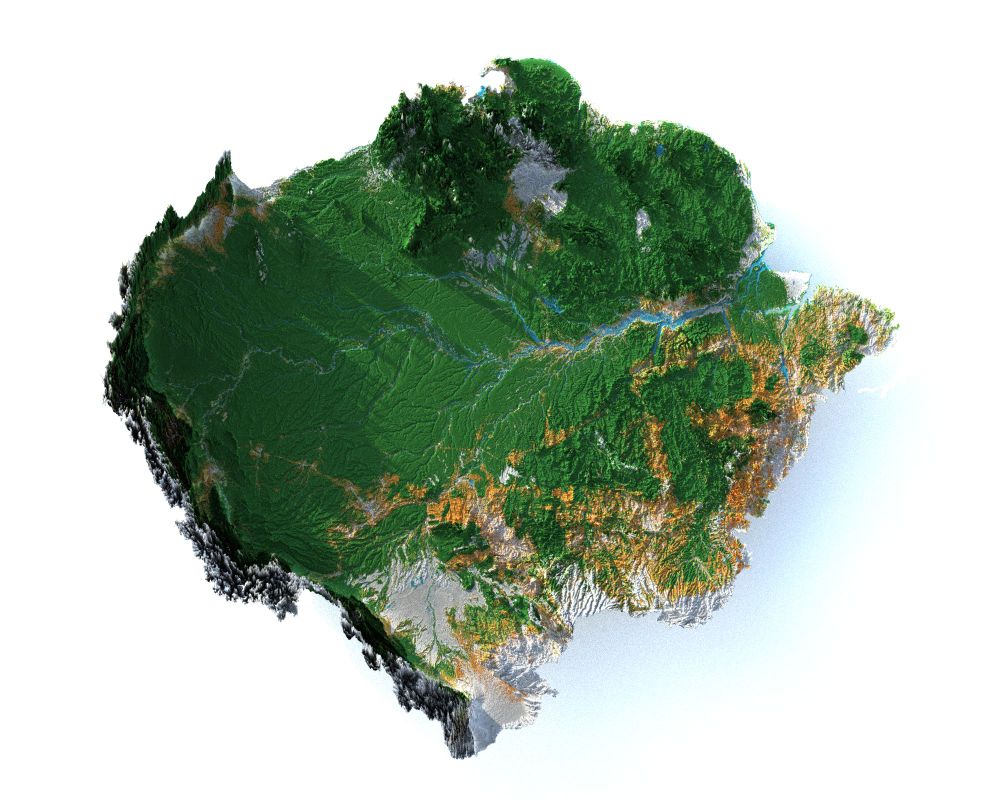
𝖨𝗇 𝖡𝗋𝖺𝗓𝗂𝗅’𝗌 𝗌𝗈𝗎𝗍𝗁𝖾𝗋𝗇 𝖺𝗀𝗋𝗂𝖼𝗎𝗅𝗍𝗎𝗋𝖺𝗅 𝗓𝗈𝗇𝖾𝗌, 𝗉𝗋𝗈𝖽𝗎𝖼𝗍𝗂𝗏𝗂𝗍𝗒 𝗀𝖺𝗂𝗇𝗌 𝖼𝖺𝗇 𝖻𝖾 𝖽𝗈𝗎𝖻𝗅𝖾-𝖾𝖽𝗀𝖾𝖽: 𝗍𝗁𝖾𝗒 𝗆𝖺𝗒 𝗂𝗇𝖽𝗂𝖼𝖺𝗍𝖾 𝗂𝗇𝗍𝖾𝗇𝗌𝗂𝖿𝗂𝖼𝖺𝗍𝗂𝗈𝗇 𝗋𝖺𝗍𝗁𝖾𝗋 𝗍𝗁𝖺𝗇 𝗋𝖾𝗌𝗍𝗈𝗋𝖺𝗍𝗂𝗈𝗇, 𝗈𝖿𝗍𝖾𝗇 𝖺𝖼𝗁𝗂𝖾𝗏𝖾𝖽 𝗍𝗁𝗋𝗈𝗎𝗀𝗁 𝗁𝗂𝗀𝗁 𝖿𝖾𝗋𝗍𝗂𝗅𝗂𝗓𝖾𝗋 𝗂𝗇𝗉𝗎𝗍𝗌 𝖺𝗇𝖽 𝗆𝖾𝖼𝗁𝖺𝗇𝗂𝗓𝖺𝗍𝗂𝗈𝗇.
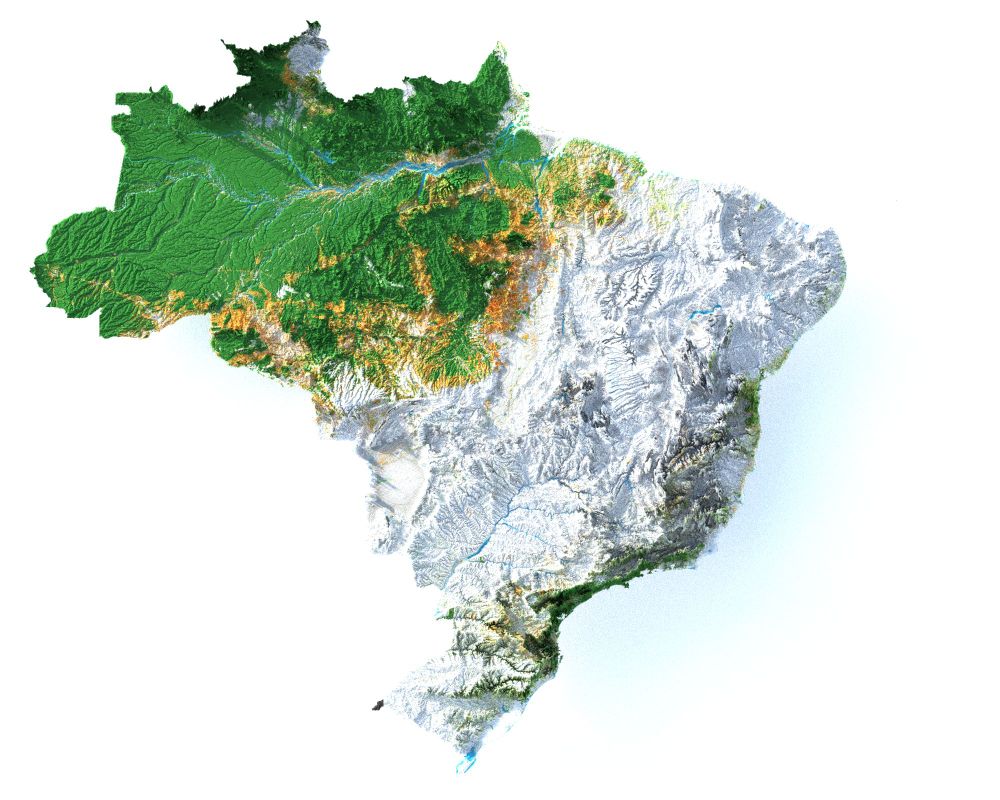
🇧🇷 L🅐🅝🅓 P🅡🅞🅓🅤🅒🅣🅘🅥🅘🅣🅨 D🅨🅝🅐🅜🅘🅒🅢 🅘🅝 B🅡🅐🅩🅘🅛
𝖦𝗋𝖾𝖾𝗇𝗂𝗇𝗀 𝗂𝗇 𝗍𝗁𝖾 𝖠𝗆𝖺𝗓𝗈𝗇 & 𝗌𝗈𝗎𝗍𝗁 𝗌𝗁𝗈𝗐𝗌 𝗋𝗂𝗌𝗂𝗇𝗀 𝗉𝗋𝗈𝖽𝗎𝖼𝗍𝗂𝗏𝗂𝗍𝗒 🌱
𝖡𝗎𝗍 𝗈𝗋𝖺𝗇𝗀𝖾 & 𝗒𝖾𝗅𝗅𝗈𝗐 𝗓𝗈𝗇𝖾𝗌 𝗋𝖾𝗏𝖾𝖺𝗅 𝗌𝗍𝗋𝖾𝗌𝗌 𝖽𝖾𝖿𝗈𝗋𝖾𝗌𝗍𝖺𝗍𝗂𝗈𝗇, 𝖽𝗋𝗈𝗎𝗀𝗁𝗍 & 𝖼𝗅𝗂𝗆𝖺𝗍𝖾 𝗉𝗋𝖾𝗌𝗌𝗎𝗋𝖾 𝗋𝖾𝖽𝗎𝖼𝗂𝗇𝗀 𝗋𝖾𝗌𝗂𝗅𝗂𝖾𝗇𝖼𝖾 🌾🔥
𝖧𝗈𝗐 ? 𝗌𝖾𝖾 @milos-makes-maps.bsky.social 𝗍𝗎𝗍
#𝖫𝖺𝗇𝖽𝖣𝖾𝗀𝗋𝖺𝖽𝖺𝗍𝗂𝗈𝗇 #𝖡𝗋𝖺𝗓𝗂𝗅 #𝖤𝖺𝗋𝗍𝗁𝖮𝖻𝗌𝖾𝗋𝗏𝖺𝗍𝗂𝗈𝗇 #𝖱𝗌𝗍𝖺𝗍s
15.10.2025 21:52 — 👍 12 🔁 4 💬 0 📌 0
Thank you for the shout-out, @milos-makes-maps.bsky.social 😁
05.05.2025 14:48 — 👍 1 🔁 0 💬 0 📌 0
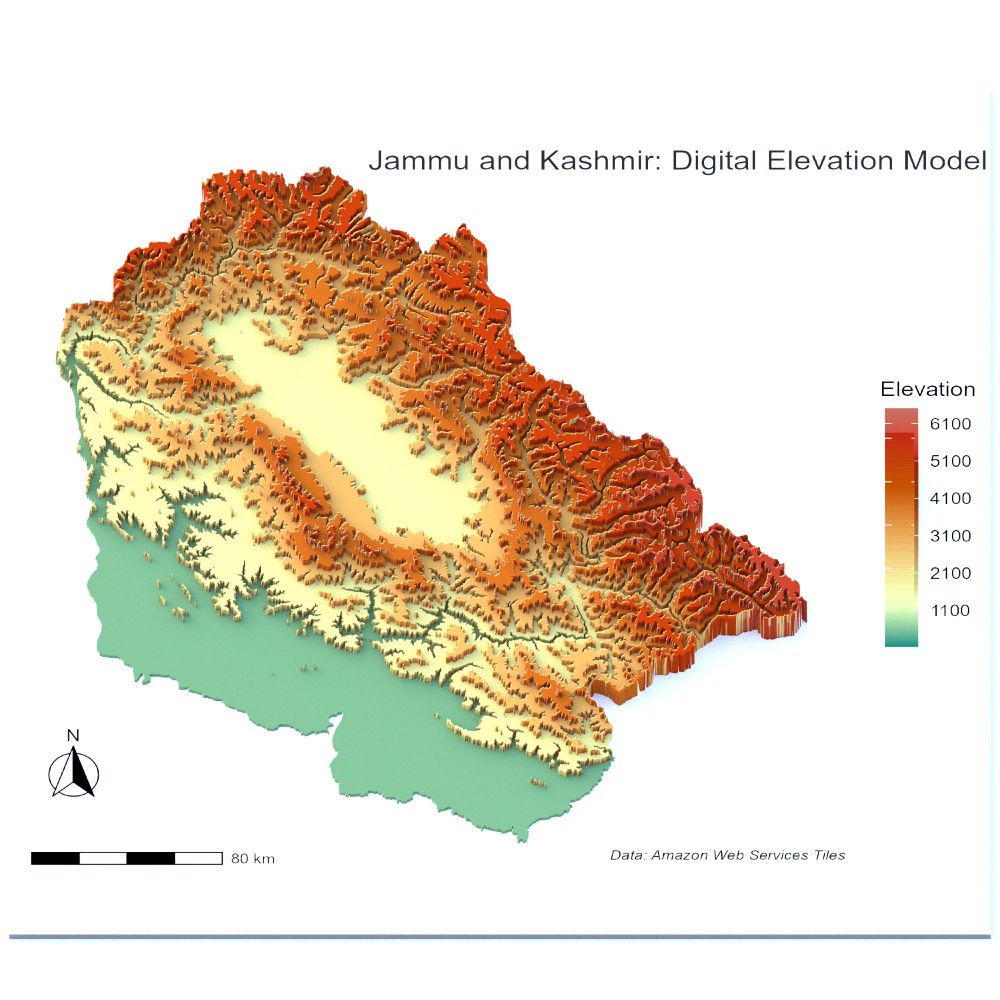
🗻 Just finished rendering this Digital Elevation Model of #Jammu & #Kashmir using #Tanaka Highlights 🎨
Loving how the technique brings out the terrain, sharp ridgelines, soft basins, and deep valleys all pop beautifully.
🔗Tut by @milos-makes-maps.bsky.social 😍
#DEM #TanakaHighlights #Cartography
04.05.2025 23:00 — 👍 3 🔁 0 💬 0 📌 1
😂😅
26.04.2025 18:09 — 👍 0 🔁 0 💬 0 📌 0
Haha, no problem at all! Thanks for the smile! 😄
26.04.2025 18:08 — 👍 1 🔁 0 💬 1 📌 0
🤣 I can see that! I promise it's not a salad leaf
26.04.2025 18:07 — 👍 0 🔁 0 💬 0 📌 0
Hey! There's no link for the map, as it's not part of any published report or paper, just my habit of sharing my work 😁
26.04.2025 18:03 — 👍 1 🔁 0 💬 1 📌 0

𝖥𝗂𝗑𝖾𝖽 𝗍𝗁𝖺𝗍! 🎯
𝖲𝗐𝗂𝗉𝖾 𝗍𝗈 𝗌𝖾𝖾 𝖨𝗇𝖽𝗂𝖺'𝗌 𝗋𝗂𝗏𝖾𝗋𝗌 𝗂𝗇 𝟥𝖣.... 𝖻𝗅𝖾𝗇𝖽𝗂𝗇𝗀 𝖾𝗅𝖾𝗏𝖺𝗍𝗂𝗈𝗇, 𝗍𝗈𝗉𝗈𝗀𝗋𝖺𝗉𝗁𝗒, 𝖺𝗇𝖽 𝗁𝗒𝖽𝗋𝗈𝗅𝗈𝗀𝗒
🔥𝖥𝗎𝗇 𝖿𝖺𝖼𝗍: 𝟤𝟪𝟪𝟢 𝗋𝗂𝗏𝖾𝗋𝗌 𝖼𝗋𝗈𝗌𝗌 𝗍𝗁𝖾 𝖻𝗈𝗋𝖽𝖾𝗋𝗌, 𝖺𝗇𝖽 𝗍𝗁𝖾 𝗅𝗈𝗇𝗀𝖾𝗌𝗍 𝗉𝖺𝗍𝗁 𝗋𝗎𝗇𝗌 𝟥𝟢𝟫,𝟣𝟣𝟧 𝗄𝗆!
#𝖦𝖨𝖲 #𝖱𝗌𝗍𝖺𝗍𝗌 #𝖬𝖺𝗉𝗉𝗂𝗇𝗀 #𝖨𝗇𝖽𝗂𝖺 #𝖧𝗒𝖽𝗋𝗈𝗅𝗈𝗀𝗒
26.04.2025 12:54 — 👍 17 🔁 1 💬 3 📌 1

🌀 826 rivers flow into the DRC 🇨🇩
Today’s deep dive? Unveiling a river network so vast it spans all 26 provinces, linking ecosystems, borders, and lives.
From Bas-Uele to Kinshasa 💧✨
#Geospatial #Hydrology #DRC #RStats #WaterMapping
25.04.2025 13:34 — 👍 10 🔁 2 💬 0 📌 0

🇫🇷 𝗠𝗔𝗣𝗣𝗜𝗡𝗚 𝗛𝗘𝗔𝗧 & 𝗣𝗢𝗣𝗨𝗟𝗔𝗧𝗜𝗢𝗡 🌡️👥
With summer heatwaves intensifying, I overlaid #MODIS LST and #GHSL 2030 population to spot where heat and people collide
#ClimateAction #UrbanResilience #GIS #HeatIslands #Sustainability
23.04.2025 17:01 — 👍 5 🔁 3 💬 1 📌 0
Hmmm let do this, next time I will zoom in to Lagos and use colors that really highlights the LST effects!
22.04.2025 21:33 — 👍 0 🔁 0 💬 1 📌 0
One thing to note is that there are no red colors in the legend. One might expect high LST values in Lagos, but they are represented using blue the color indicating the highest LST level
22.04.2025 21:21 — 👍 0 🔁 0 💬 1 📌 0

🔥🌳 3D view of #Nigeria’s heat & green cover 🇳🇬
MODIS LST × Canopy Height = a map where trees cool, cities heat 🌿🔥
South = cooler, denser
North = hotter, barer
Cities = heat islands 🏙️
#GIS #Climate #Nigeria #DataViz #LST #Canopy #Trees #Forest
22.04.2025 19:53 — 👍 4 🔁 0 💬 1 📌 0


𝐂𝐚𝐦𝐛𝐨𝐝𝐢𝐚, 𝐜𝐚𝐧 𝐈 𝐡𝐞𝐚𝐫 𝐲𝐨𝐮 𝐬𝐡𝐨𝐮𝐭 🌿📢 for our forests?!
From 1990 to 2024, we’ve seen a massive shift: green forests turning into scattered patches. The land is changing fast......Time to act, protect, and restore!
#Cambodia #Forests #ClimateAction #TMFChange #ReforestCambodia #Rstats #Asia
21.04.2025 16:37 — 👍 8 🔁 2 💬 0 📌 0

👀 You saw #Brazil & the #Amazon TMF in #3D…
My people in the #DRC said: 𝑾𝒉𝒆𝒓𝒆’𝒔 𝒐𝒖𝒓𝒔? 😏
Well… here it is! 🇨🇩✨
𝐓𝐌𝐅 𝐨𝐟 𝐭𝐡𝐞 𝐃𝐑𝐂 𝐢𝐧 𝐬𝐭𝐮𝐧𝐧𝐢𝐧𝐠 3𝐃! 🌿🌍
A vibrant forest, rich in life & vital for our planet 💧🌳
#TMF #DRC3D #CongoBasin #NatureIn3D #GIS #MappingTMF #Africa #ForestsMatter #ClimateAction #R
20.04.2025 08:59 — 👍 3 🔁 1 💬 0 📌 0
 20.04.2025 01:03 — 👍 1 🔁 0 💬 0 📌 0
🟡 Mapping Africa's Aid Inequity: 15 years where global aid fell below average. 🚨
Using R, I visualized this disparity in an animated map. In 2005, Africa got just 4.9% of global aid, less than 1 in 20 dollars.
🌍 Data Source: #WorldBank
#R #DataForDevelopment #AidAllocation #MappingAfrica
20.04.2025 01:01 — 👍 2 🔁 0 💬 1 📌 0
✅ The masterpiece for 🇧🇷 is here 🌱🔥 !
🌳🌎✨ Tropical Moist Forest in full #3D GLORY — 2024 style.
🎨 + 🛰️ + 🌿 = WOW
📢 Let’s hear it, #Brazil! 💚💛
#3D #Brazil #RemoteSensing #GIS #EarthObservation #Rstats #Science
19.04.2025 21:01 — 👍 10 🔁 3 💬 0 📌 0
✅ I did my part...
🌳🌍 3D Amazon Rainforest: 2024 Tropical Moist Forest edition!
Elevation, vegetation, human impact: all in one view
📊 Data: forobs.jrc.ec.europa.eu/TMF/data
#3D #Amazon #EarthObservation #GIS #RemoteSensing #Rstats #EOData #SouthAmerica #Brazil #Peru
19.04.2025 17:32 — 👍 17 🔁 3 💬 1 📌 0
Forest Observations
Hi, this is actually my own work, there’s no formal report available at the moment. The dataset can be downloaded from: forobs.jrc.ec.europa.eu/TMF/data
You can also explore annual global changes here: forest-observatory.ec.europa.eu/forest/tmf
19.04.2025 13:47 — 👍 0 🔁 0 💬 0 📌 0

𝐅𝐫𝐚𝐧𝐜𝐞'𝐬 𝐂𝐥𝐢𝐦𝐚𝐭𝐞 🌡️🍃
This bivariate map reveals where temperature meets vegetation across France. Mediterranean regions glow magenta (hot+dry), while northern greens showcase resilient plant life.
#DataViz #ClimateScience #RemoteSensing
16.04.2025 13:20 — 👍 3 🔁 1 💬 0 📌 0


 16.04.2025 08:42 — 👍 0 🔁 0 💬 0 📌 0
🇧🇷 Tropical Moist Forest Crisis in Brazil: Since 1990, Brazil lost 86.86 Mha of undisturbed forests, while regrowth only covered 16.08 Mha. Deforestation escalates by 1,533%, and degradation is climbing. We must act for a sustainable future. 🌍 #Deforestation #ClimateAction #Brazil #Biodiversity
16.04.2025 08:40 — 👍 0 🔁 0 💬 1 📌 0

Saudi Arabia 🇸🇦 | Climate Reality in Color
Average Site Water Balance (swb) & Climate Moisture Index (cmi)
📆 1981–2010 | CHELSA BIOCLIM+
From the green slopes of جبال السروات to the dry heart of الربع
الخالي
#ClimateScience #SaudiArabia #GIS #Hydrology #المناخ #البيئة
14.04.2025 07:13 — 👍 1 🔁 0 💬 0 📌 0


🟡 🅒🅛🅘🅜🅐🅣🅔 🅟🅡🅞🅙🅔🅒🅣🅘🅞🅝
A side-by-side of 🇫🇷 #France and 🇮🇹 #Italy showing projected climate shifts under #SSP1-2.6 (mitigation) vs #SSP5-8.5 (high emissions).
Data from the #MPI-ESM1 model
Access the #BIOCLIM+ dataset:
🔗 chelsa-climate.org/exchelsa-ext...
#ClimateData #RStats #BIOCLIM+ #CHELSA
14.04.2025 00:30 — 👍 2 🔁 0 💬 0 📌 0

Are quieter regions left behind or do they simply function differently?
#France #population #urbanplanning #Rstats
09.04.2025 00:26 — 👍 5 🔁 2 💬 0 📌 0


🗺️ Hot or not? 🇸🇦
New #climateERA5 vs #climateCHELSA bivariate maps reveal striking differences in temp & rainfall across #climateSaudiArabia (1981–2010)!
🌡️#climateERA5: Hotter, drier deserts
🌧️#climateCHELSA: Cooler, wetter, more detailed
📊 Your dataset really matters in #climateMapping #R #2Dmaps
07.04.2025 20:56 — 👍 2 🔁 0 💬 0 📌 0

Ohh silly me! 🤦♀️ How did I miss that?! 🙃... Classic map betrayal! Here is the wright map
07.04.2025 16:38 — 👍 1 🔁 0 💬 1 📌 0
PhD in Walther Group at University of Mainz
Soft Robotic Engines and Reprogrammable Metamaterials for Life-Like Materials on the Macro- and Microscale
Senior data scientist and project manager.
Data scientist @ Cofactor. R, Shiny and Python.
World's best cloud-native GIS
Coastal Earth Observation Scientist from Canberra, Australia. Using satellite remote sensing 🛰️, open-source geospatial 🔓🗺️, Python + R 🧑💻 and dataviz 🎨 to map the earth through space + time... 🌏
Ecrivain Lyonnais (#Interfeel), chercheur en psycho sociale (Brunel University) sur les théories du complot !
I ❤️ dataviz!
Author of
- data-to-viz.com
- the R, Python, d3 and React graph galleries
- dataviz-inspiration.com
dataviz designer @EU_ISS (twitter) . shapes, colors, and stories on security, foreign policy, and others . also on twitter.com/cd_trich
The EUISS is the EU’s foreign & security policy think tank. We provide critical analysis and insights to inform the EU’s strategic choices.
🌐 iss.europa.eu
Senior Manager Data Science and Engineering at | Docker Captain 🐳| Time-series analysis & forecasting
My newsletters:
Weekly updates: https://ramikrispin.substack.com
AIOps: https://theaiops.substack.com
Forecasting: https://theforecaster.substack.com
Spatial Data Scientist • Artist • Economist | #ClimateRisk #Dataviz #Maps #DigitalArt #3D in London | X: Julian_H0ffmann
Portfolio: https://www.julian-hoffmann-anton.com/
Associate Professor @UTKnoxville | Amazon Scholar | Creator of #geemap & #leafmap | Talk about #Geospatial #GeoPython #DataViz #GIS #FOSS #EarthEngine
Infographics Designer at Finanz und Wirtschaft
Science Visualization & Communication
M.A. Knowledge Visualization
Portfolio: http://stjep.ch
LinkedIn: https://www.linkedin.com/in/stjep/
Linktree: https://linktr.ee/stjep
A. Nicolas. Cartographe/géomaticien. #SIG #HautesAlpes #CNRSÉditions #RevueXXI #ToponymieRomantique #QuizzTown #PosterCarto 🌍🍷🗺
www.le-cartographe.net
Cartography is my passion & profession. Author of CARTOGRAPHY. & THEMATIC MAPPING. Maps+drums+beer+snowboards+footy+politics+sarcasm. 🇬🇧 in 🇺🇸 Views mine. links.esri.com/mappyhour
Dataviz designer, psychiatrist, PhD
https://karaman.is
· Economist @univlorraine.bsky.social, en français and in English
· I study how humans influence each other in organizations, at work, in scientific communities, and online #Rstats
· He/Him 🏳️🌈
🌐 https://o.simardcasanova.net
📍 Nancy, Lorraine, France 🇪🇺
Powerpoint by day, #ggplot2 by night. Here for dataviz and #rstats content and rants about football. 📊⚽️
Based in Cologne, Germany.
-Mapping the world- Dr. in Physical Geography | environmental health - bioclimatology - geography. RC Researcher from 🇩🇪 at @mbgcsic.bsky.social @csic.es in 🇪🇸 #rstats #dataviz
Secretary of the @aeclim.org
📍Galicia
ℹ️ https://dominicroye.github.io