I’m loving the new Cryptid Summer album “Where The Earth Has Teeth”. Thanks for putting it on my radar @totalvibration.bsky.social !
Goth-tinged postpunk at its finest.
cryptidsummer.bandcamp.com/album/where-...
#musicsky
@ckdc.bsky.social
Creative Director at Graphicacy
I’m loving the new Cryptid Summer album “Where The Earth Has Teeth”. Thanks for putting it on my radar @totalvibration.bsky.social !
Goth-tinged postpunk at its finest.
cryptidsummer.bandcamp.com/album/where-...
#musicsky

Screenshot from the bluesky map project, showing nodes with the following labels: "UFO and Paranormal Enthusiasts" "Queer Youth Fandom Community" "Jacksonville Jaguars Community" "Vaporwave & Experimental Electronic Music"

Screenshot from the bluesky map project, showing nodes with the following labels: "Jam Band Community" "Sapphic Fiction Authors & Community" "Graphics Programming Professionals"
Bluesky contains multitudes
bluesky-map.theo.io
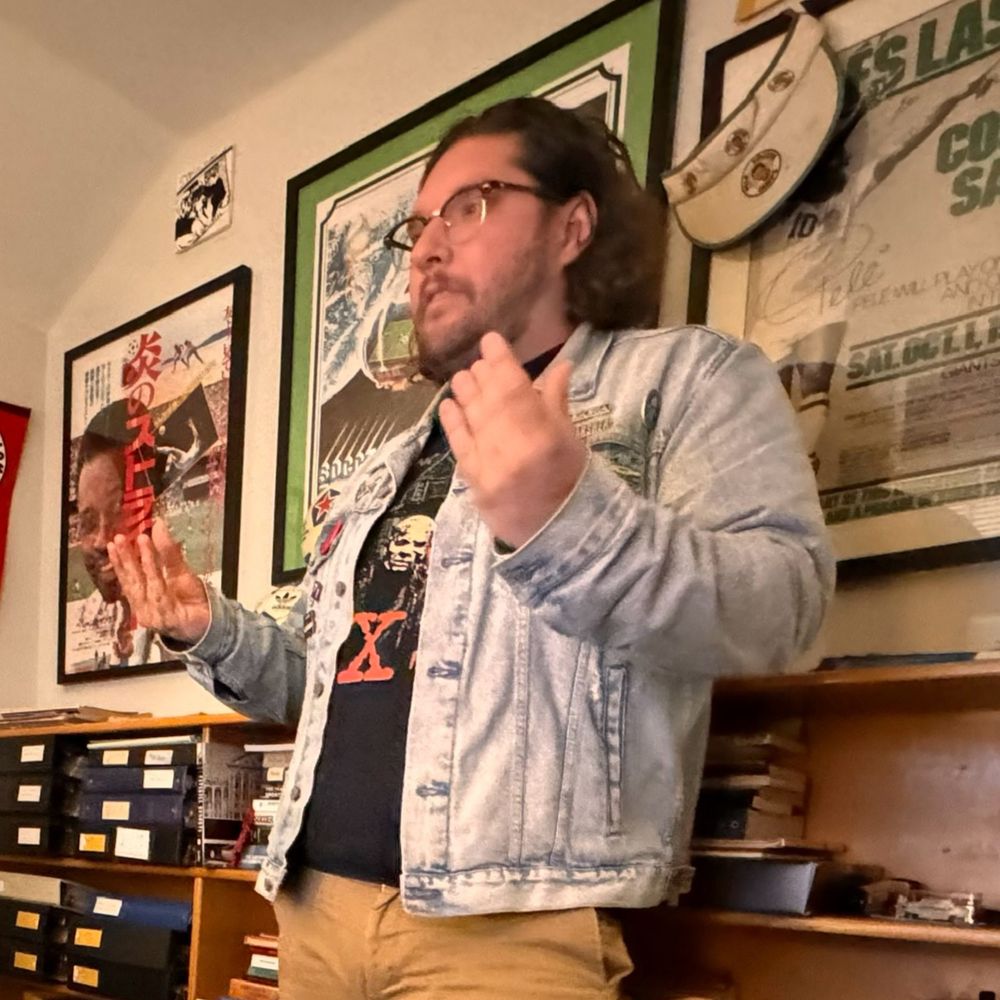
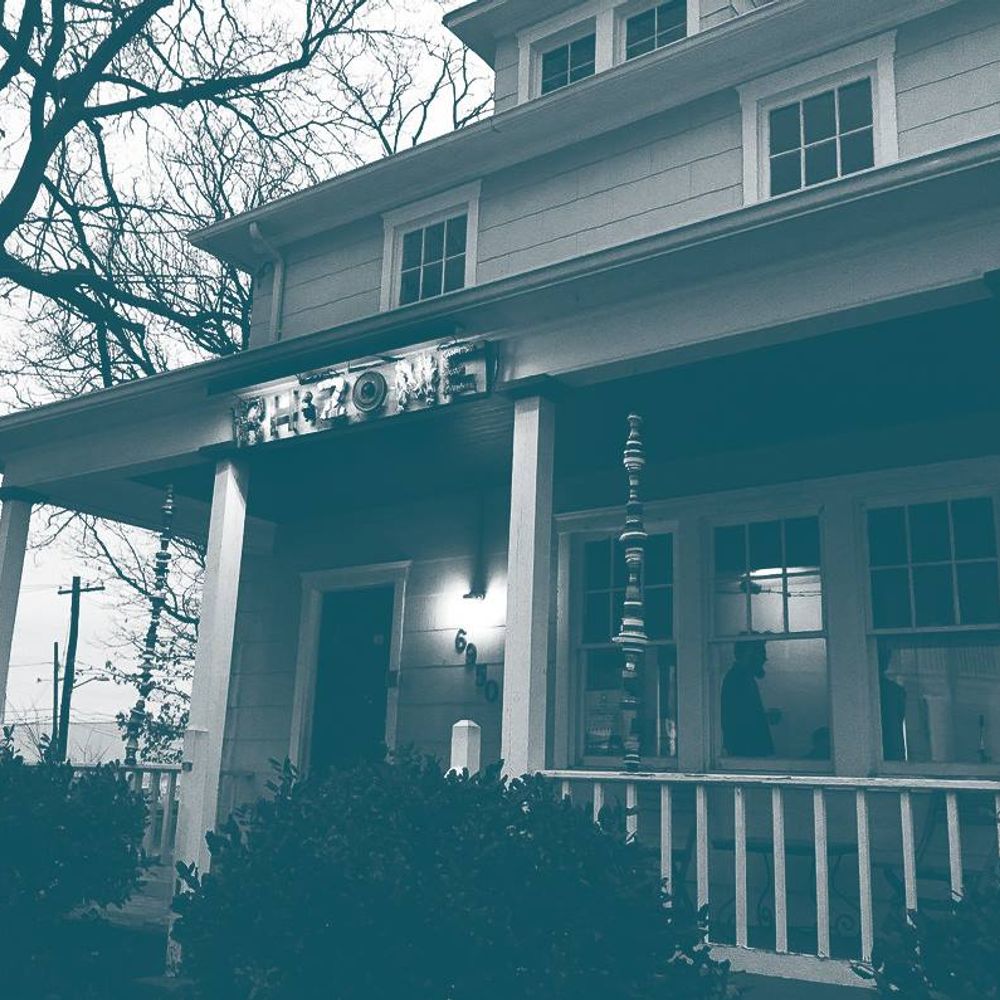
this is my other band! should be a fun show
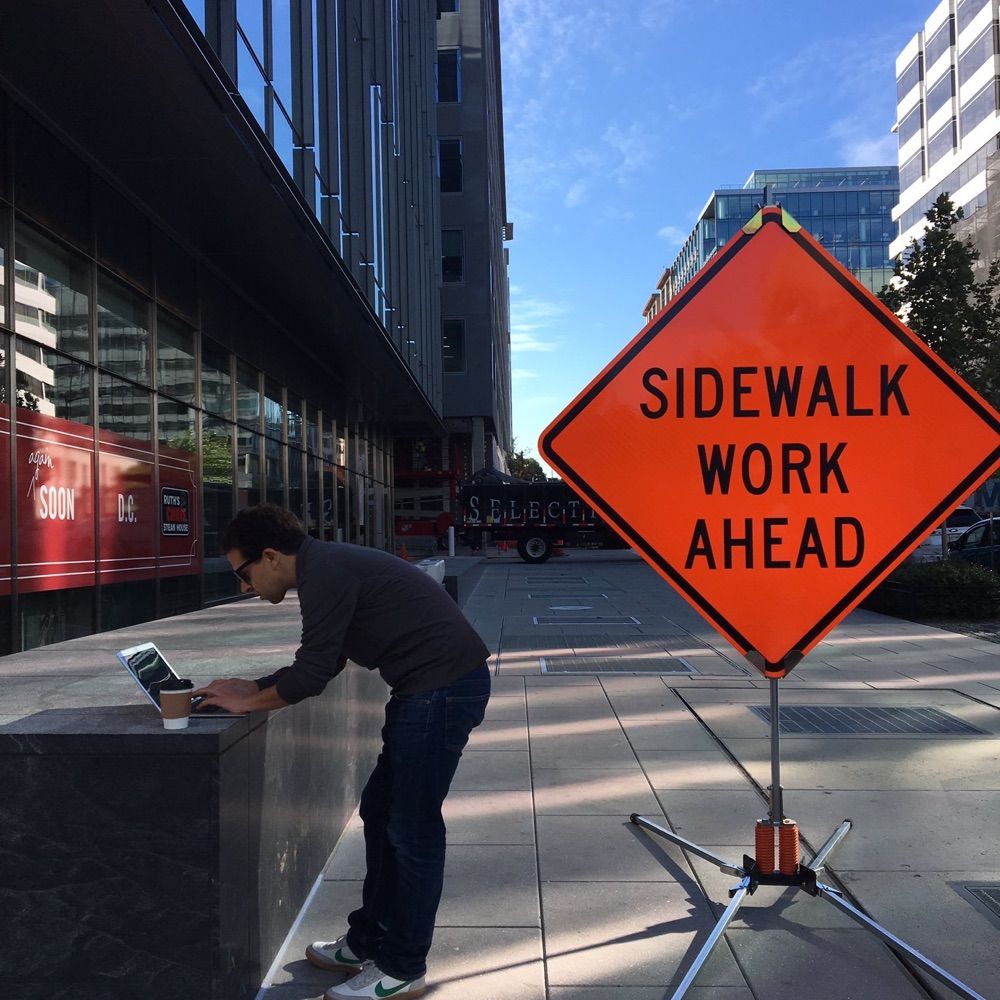
05.02.2026 16:44 — 👍 0 🔁 0 💬 0 📌 0In less than a week the Kennedy Center has effectively closed and our local DC paper has been gutted, both by billionaires.
I don’t think immigrants are our problem in this country.
support one of the best music and culture writers out there, recently laid off by the washington post
04.02.2026 21:16 — 👍 1 🔁 0 💬 0 📌 0
Screenshot of the lock screen from my iphone, which shows a background image of a red electric guitar. The Clock display is numerals in the "liquid glass" UI approach that iOS has adopted, which renders it almost illegible against the background image
I hate it so much. This is what my lock screen looks like. This more than anything is pushing me towards getting a physical wrist watch. For 15+ years, I'm used to taking my phone out of my pocket and glancing at the screen to tell the time. That is now a chore as I try to decipher the numbers here
09.12.2025 20:15 — 👍 0 🔁 0 💬 0 📌 0
My band Cryptid Summer is releasing our debut LP in early 2026, and the first single is out today! it's bandcamp friday, so a great day to order (all $$ goes straight to the bands/labels). For fans of loud music made by humans playing real instruments
cryptidsummer.bandcamp.com/album/where-...

Deciper, interpret and accept Indigenous knowledge and traditional storytelling practices as data sources.

In a world full of digital gaps, our approach to data is analog.
With traditional data viz, there’s often an unstated goal of objectivity...but with data art projects, all of the choices are subjective.
Day one of #Outlier2025 is officially in the books! From inspiring keynotes to thought-provoking discussions, today was a masterclass on how we approach data, design and the communities they serve. What was your biggest takeaway? Drop your thoughts below in the comments.
12.06.2025 01:45 — 👍 12 🔁 1 💬 0 📌 1Looking forward to this, been working on squeezing the story of a 9 month project lifecycle into a 10 min talk
30.05.2025 01:06 — 👍 3 🔁 0 💬 0 📌 0World Resources Institute has open sourced and made available the base map files they use. This direct link is to the SVG downloads, which include files for Miller and winkel tripel projection, with a layer for disputed borders.
github.com/wri/wri-boun...

an infrographic showing the live performance history of the band Fugazi. The arc diagram at the bottom shows which bands shared bills with eachother.
I used an arc diagram for this visualization on the live performance history of the band Fugazi, for which bands they played withe most. The arcs show which bands shared bills with eachother:
www.carniklirs.com/project/fugazi