🚨new preprint🚨
Paper on bursty communication dynamics in multidisciplinary health care teams with M. Janssens, S. C. P. van der Bruggen, and L. Beetroot that will be presented next Thursday (July 17) at the 2025 Interdisciplinary Network for Group Research Conference in Rotterdam.
11.07.2025 08:29 — 👍 0 🔁 0 💬 0 📌 0
🚨 New preprint + open pipeline 🚨
CVML-based behavioral observations: osf.io/preprints/ps...
Co-led with @wimpouw.bsky.social, alongside @jamestrujillo.bsky.social, @babajideowoyele.bsky.social, @tjwiltshire.bsky.social, F. Hasselman, N. Siekiera, J. Raczaszek-Leonardi.
👀 Take a look & use it!
23.06.2025 15:01 — 👍 5 🔁 4 💬 0 📌 0
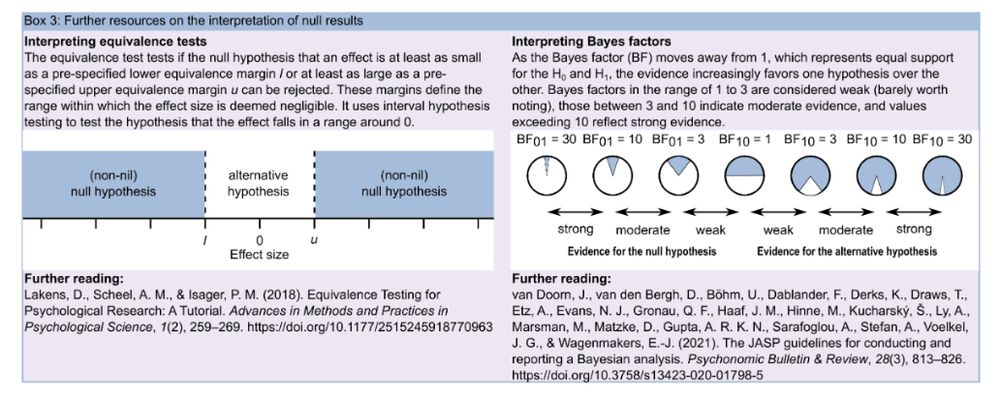
Further resources on the interpretation of null results.
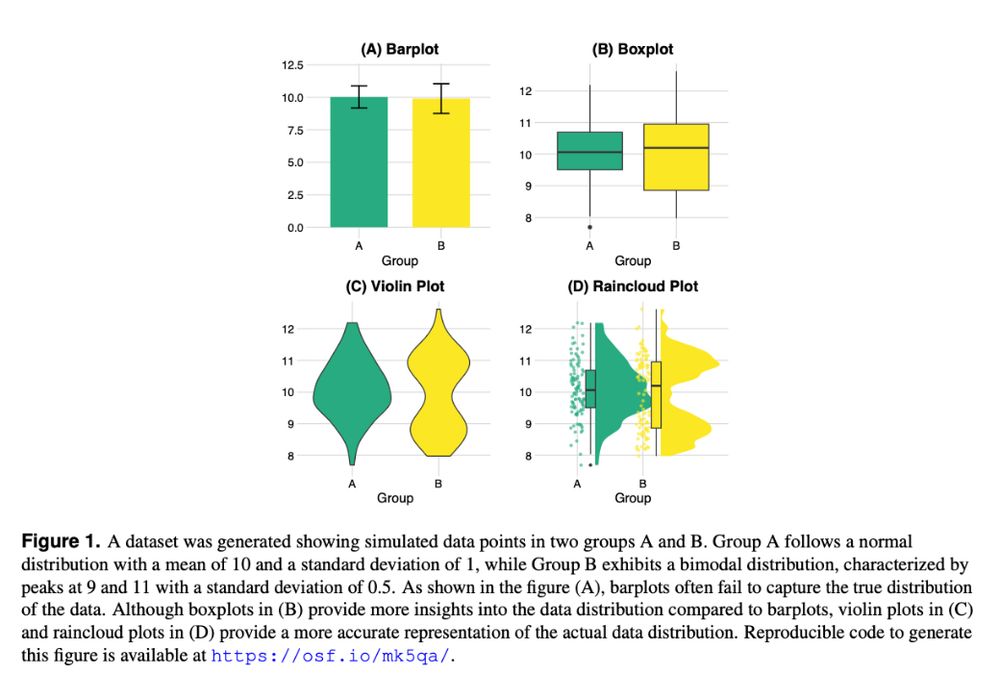
A dataset was generated showing simulated data points in two groups A and B. Group A follows a normal
distribution with a mean of 10 and a standard deviation of 1, while Group B exhibits a bimodal distribution, characterized by
peaks at 9 and 11 with a standard deviation of 0.5. As shown in the figure (A), barplots often fail to capture the true distribution
of the data. Although boxplots in (B) provide more insights into the data distribution compared to barplots, violin plots in (C)
and raincloud plots in (D) provide a more accurate representation of the actual data distribution. Reproducible code to generate
this figure is available at https://osf.io/mk5qa/.
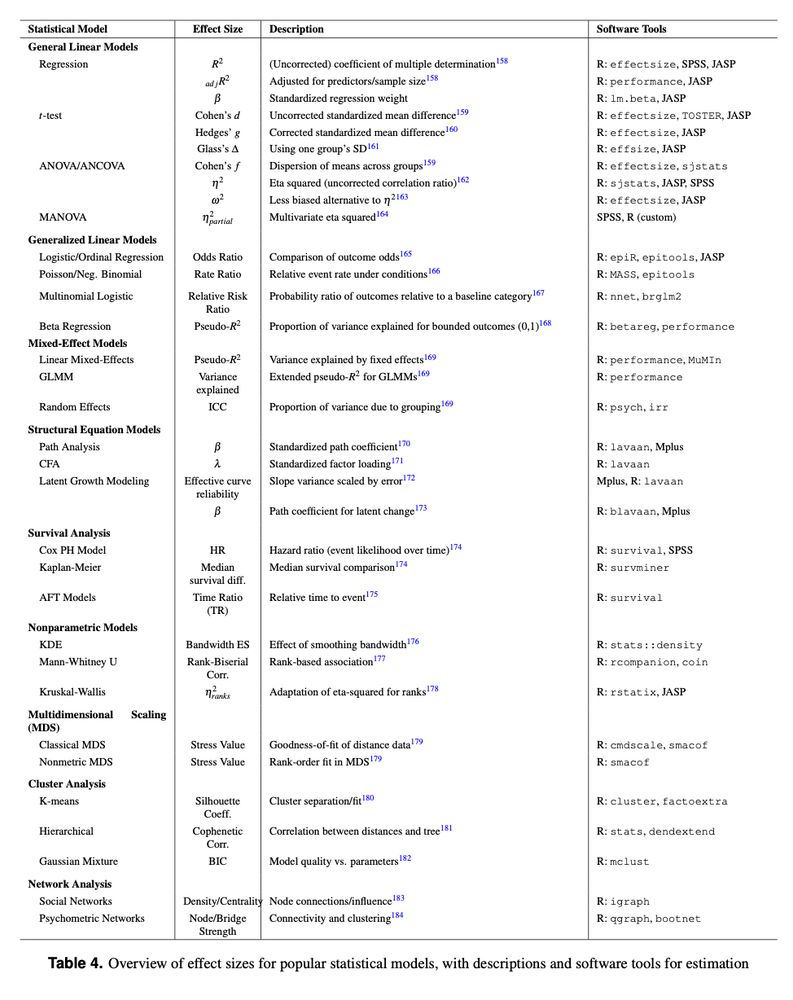
Table 4. Overview of effect sizes for popular statistical models, with descriptions and software tools for estimation
Papers are one-way conversations. Getting additional info from authors can be hard, so clear reporting from the outset is critical.
In our new preprint, we (@annalschubert.bsky.social, Meike Steinhilber & @heeminkang.bsky.social) propose a set of psych reporting guidelines osf.io/preprints/ps...
28.05.2025 11:48 — 👍 68 🔁 19 💬 1 📌 2
Biofeedback in Team Settings: A Systematic Review of Applications and Outcomes: https://osf.io/awmb4
04.04.2025 13:41 — 👍 1 🔁 1 💬 0 📌 0
OSF
And as a pre-print here: osf.io/preprints/ps...
22.11.2024 12:55 — 👍 0 🔁 0 💬 0 📌 0

First post here on Bluesky. In a recent paper, we show that higher team synchronization of player position in the virtual environment (in certain movement dimensions) , negatively predicts performance in a professional e-sports competition (Dota 2) across consecutive years.
22.11.2024 12:55 — 👍 2 🔁 0 💬 1 📌 0
Research, news, and commentary from Nature, the international science journal. For daily science news, get Nature Briefing: https://go.nature.com/get-Nature-Briefing
Psychology professor who also makes music. See link below:
https://open.spotify.com/artist/4zrxJCawAG85dzMxug7HNM?si=nsT7_QR_R-ahMs0MHFgVIA
Politics Prof @powimz.bsky.social | parties, elections, attitudes, behaviour | right-wing extremism/populism/radicalism https://www.kai-arzheimer.com/
PhD Student @UCLA | Communication 🗣🗣& Social Neuroscience 🧠🧠 | Research: Multimodal dynamics of human communication and connections | Snowboard enthusiast 🏂
We’re Claymatic Games! Working on Platypus Reclayed and Clodhoppers 🚀 Specialising in claymation art style, couch-coop, local and multiplayer games
🤖 claymatic.games
SIPS brings together scholars working to improve methods and practices in psychological science. Join us!
https://improvingpsych.org/membership/
#PsychSciSky #OpenScience
improvingpsych.org
Associate Prof Leiden Uni. Studying mental health problems as systems. http://eiko-fried.com. Building an early warning system for depression at http://WARN-D.com.
asst. prof. of psychology at Jagiellonian University. Researching dev. of coordination of perspectives. Teaching cultural dev. psych. & research methods. Lead child lab at JU.
Translating the Science of Health & Longevity
USD Bio Professor, Drug Developer
📖 Longer content on LinkedIn:
linkedin.com/in/jon-brudvig-phd-9b1830134
📰Sign up for my monthly Substack newsletter, Translation:
jonbrudvig.substack.com
Mood & Memory researcher with a computational bent. https://www.nicolecrust.com. Science advocate. Prof (UPenn Psych) - on leave as a Simons Pivot Fellow. Author: Elusive Cures. https://press.princeton.edu/books/hardcover/9780691243054/elusive-cures
Professor of Psychology at NYU (jayvanbavel.com) | Author of The Power of Us Book (powerofus.online) | Director of NYU Center for Conflict & Cooperation | trying to write a new book about collective decisions
Neurogeneticist interested in the relations between genes, brains, and minds. Author of INNATE (2018) and FREE AGENTS (2023)
Professor, Santa Fe Institute. Research on AI, cognitive science, and complex systems.
Website: https://melaniemitchell.me
Substack: https://aiguide.substack.com/
Asst Professor Psychology & Data Science @ NYU | Working on brains & climate, separately | Author of Models of the Mind: How physics, engineering, and mathematics have shaped our understanding of the brain https://shorturl.at/g23c5 | Personal account (duh)
Psychologist who studies and writes about human nature—including morality, pleasure, and religion. Sustack: https://smallpotatoes.paulbloom.net/
Social science and other distractions. Old posts get deleted pretty quick.
https://kieranhealy.org /
https://theordinalsociety.com
Scientist/Author/Speaker; Presidential Distinguished Prof/Director Center for Science, Sustainability & the Media, U. Penn; National Academy of Sciences; Royal Society; Tyler Prize
physician-scientist, author, editor
https://www.scripps.edu/faculty/topol/
Ground Truths https://erictopol.substack.com
SUPER AGERS https://www.simonandschuster.com/books/Super-Agers/Eric-Topol/9781668067666
Professor, UW Biology / Santa Fe Institute
I study how information flows in biology, science, and society.
Book: *Calling Bullshit*, http://tinyurl.com/fdcuvd7b
LLM course: https://thebullshitmachines.com
Corvids: https://tinyurl.com/mr2n5ymk
he/him