Plot shows the attack points per individual pokemon by primary type. Primary types are grouped on the x-axis and attack points are on the y-axis. Each pokemon is a black dot overlayed on a violin plot that shows the distribution of attack points for each primary type. The violin plot is colored by the primary color of each Pokemon type. Pokemon types are arrange from left to right from lowest median attack points to highest median attack points per primary Pokemon type.
#TidyTuesday Week 13
Attack points by Pokemon Primary Type
code: github.com/lhover11/Tid...
#ggplot2 #dataviz #pokemon #Rstats
02.04.2025 02:35 — 👍 5 🔁 1 💬 0 📌 0
Did you see Garcelle is leaving? I liked her on the show. Now I wonder who Sutton will hang out with next season.
01.04.2025 00:34 — 👍 0 🔁 0 💬 0 📌 0
Total screen time Season 14 RHOBH. Anyone else surprised Sutton and Garcelle had more screen time than Dorit this season?
#RHOBH #realhousewives #dataviz #ggplot2 #RStats
30.03.2025 18:35 — 👍 2 🔁 1 💬 1 📌 0
This is a really cool plot, I love the combination with the heatmap
22.03.2025 18:20 — 👍 1 🔁 0 💬 0 📌 0
This is really cool, I love the film reels!
22.03.2025 18:13 — 👍 1 🔁 0 💬 1 📌 0
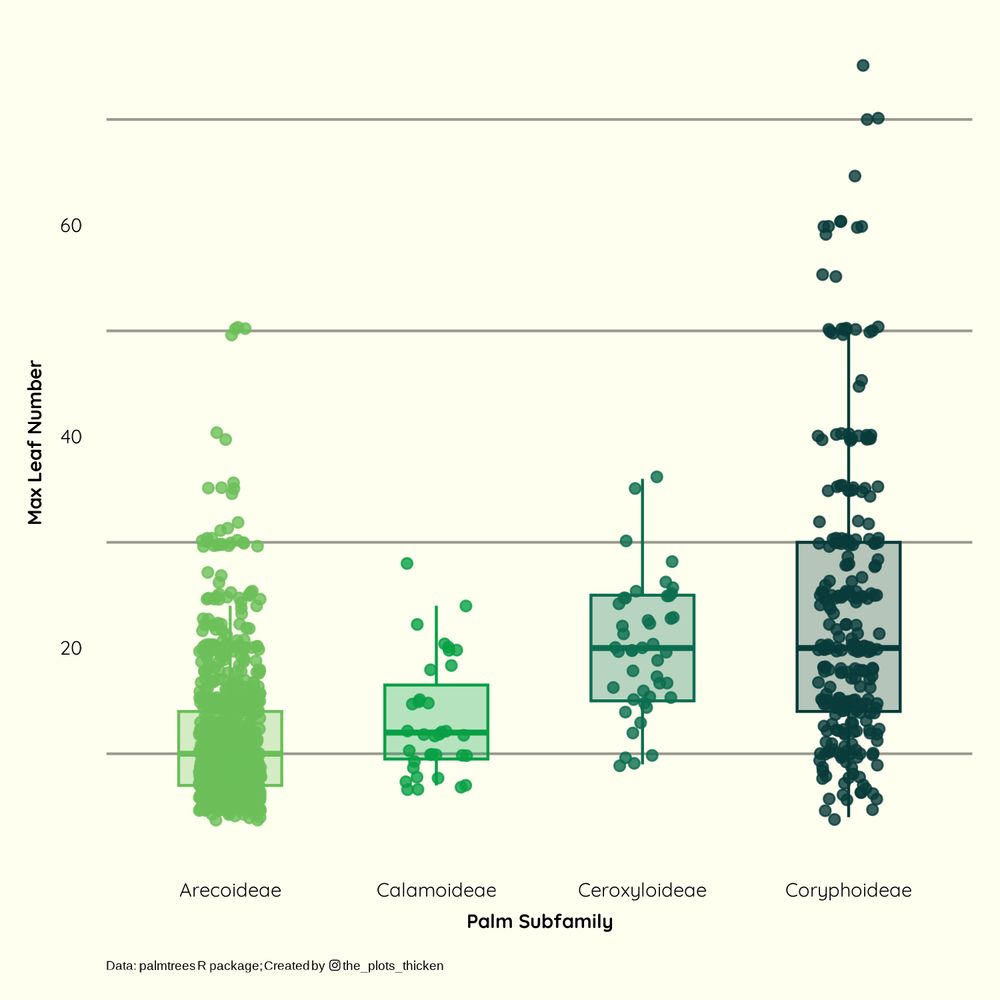
Plot shows 4 palm subfamilies, Arecoideae, Calamoideae, Ceroxyloideae and Coryphoidae and the max number of leaves palm trees have in each subfamily. Trees in all subfamilies have a wide range of max leaf numbers from Coryphoideae have
Week 11 #TidyTuesday post
Plot explores max number of leaves by Palm subfamily. Some trees have > 50 leaves, that's a lot of leaves!
Code: github.com/lhover11/Tid...
#ggplot2 #rstats #dataviz
21.03.2025 15:23 — 👍 12 🔁 1 💬 0 📌 0

Total screen time for all the RHOBH ladies far (S14). No surprise Kyle has been featured the most, but Sutton comes in second with 282 minutes. Will Dorit be #2 by the end of the season?
#RHOBH #realhousewives #dataviz #ggplot2 #RStats
16.03.2025 19:43 — 👍 2 🔁 0 💬 0 📌 0
haha, I think many kids would disagree. Next we should plot ratings from kids for comparison :)
13.03.2025 02:00 — 👍 1 🔁 0 💬 0 📌 0

Week 10 #TidyTuesday post
This plot compares Pixar movies by their Rotten Tomatoes Scores. The Toy Story movies did the best with Toy Story and Toy Story 2 getting a perfect 100 and the Cars movies did the worst.
Code: github.com/lhover11/Tid...
#ggplot2 #rstats #dataviz
12.03.2025 13:04 — 👍 4 🔁 0 💬 1 📌 0

My first #TidyTuesday post!
Analysis of Week 9 Long Beach Animal Shelter data
I focused on the adoption data - adoptions per month from 2017-2024, adoptions by animal type and how long animals are at the shelter prior to adoption.
Code: github.com/lhover11/Tid...
#rstats #ggplot2 #dataviz
05.03.2025 02:25 — 👍 10 🔁 1 💬 1 📌 0
Bioinformatics & Data Science. I’m not sure how to put it, but I **really** enjoy making charts.
🧙♂️✨📊
Independent Data Visualization Designer, Consultant & Instructor | available for projects and workshops
All things data & design with #rstats, #ggplot2, #Figma, #DataWrapper, #Flourish, and more
Co-Founder of the #30DayChartChallenge
Data engineer @ countercurrent.ai, former #climatehealth 🌡️ + #datajournalism 🗺️
Building, coding and storytelling with #rstats, #js and #swift for fun and for good 😊
Rotating Curator for the @rladies.org community💜
🔗 https://guide.rladies.org/rocur/
This week's curator: TBA
Always fighting for the people.
Wife, Momala, Auntie. She/her.
107 Days, my behind-the-scenes account of the shortest campaign in history, is available now at https://kamalaharris.link/107Days.
An Independent Data Visualisation Expert educating, inspiring, and celebrating data viz excellence, everywhere since 2010.
🇬🇧 in 🇮🇪
It’s all here http://visualisingdata.com/
Posit DS Hangout host & data educator. Data Weasel. Community Builder. Teaches R+Python.
🔉 Heeren == "hair-en" ✨
LinkedIn: https://www.linkedin.com/in/libbyheeren
DS Hangout: https://pos.it/dsh
Website: https://stevenponce.netlify.app/
GitHub: http://github.com/poncest/
LinkedIn: http://linkedin.com/in/stevenponce/
Our mission: To provide tools and resources to foster a diverse, friendly, and inclusive community of data science learners and practitioners. Join us at https://dslc.io
📊 Data visualisation specialist.
💻 #RStats | #Python | #D3.
🎨 Generative artist.
🏃♀️ Runner.
Website: https://nrennie.rbind.io/
She/her. Views my own.
R and Python developer, Data Scientist #rstats #python
https://chrisbrownlie.com
Senior Researcher in Infectious Disease Modelling @rivm-nl.bsky.social | Organizer @rladiesamsterdam.bsky.social | Crazy dog lady 🐶 🌈 (she/her)
Website: https://kylieainslie.github.io/
LinkedIn: https://www.linkedin.com/in/kylieainslie
#rstats #rladies
We are dedicated to fostering community for data visualization professionals.
Scientist and software developer. Creator of tidyplots.org. Website jbengler.de.
Associate Professor of Data Science & asst. Dean of Research at UVA School of Data Science, #Rstats enthusiast, dad, runner, guitar noise-maker. Views my own.
Web: https://stephenturner.us/
Newsletter: https://blog.stephenturner.us
Director of bioinformatics at AstraZeneca. subscribe to my youtube channel @chatomics. On my way to helping 1 million people learn bioinformatics. Educator, Biotech, single cell. Also talks about leadership.
tommytang.bio.link
JAMA is an international peer-reviewed general medical journal and a member of the JAMA Network family of journals.
🌐 JAMA.com