♟️ Who's who on the chessboard?
For #TidyTuesday, I simulated a chessboard where each piece is a top FIDE player, using the latest Elo ratings.
👑 Magnus Carlsen, still king. But who’s playing the knights?
Made with #Grapper:
playground.grapper.io/editor/gtau6...
#DataViz #Chess #FIDE
16.09.2025 08:53 — 👍 7 🔁 0 💬 0 📌 0

🏔️ Exploring Scotland’s Munros
For #TidyTuesday, I charted the 5 highest and 5 lowest Munros.
🥇 The tallest is Ben Nevis (1,345m), while some Munros barely cross the 3,000 ft mark.
Made with #Graphane:
playground.graphane.dev/editor/guf14...
#DataViz #Scotland #Mountains
19.08.2025 09:08 — 👍 17 🔁 3 💬 0 📌 0
🌍 How has Europe’s extreme weather shifted since 1975?
For #TidyTuesday, I charted attribution studies (1975–2025) showing more extreme events over time.
🔥💧🌪️🌾 Each dot = heat, flood, storm, drought ...
Made with #Graphane:
playground.graphane.dev/editor/gyesu...
#DataViz #Climate
14.08.2025 07:28 — 👍 5 🔁 0 💬 0 📌 0
📺 What happens when Netflix hits get more seasons?
This week for #TidyTuesday, I charted how viewership shifts across seasons of Netflix's top series.
🔴🟣🔵 Each line shows if the hype grew or faded.
Made with #Graphane:
playground.graphane.dev/editor/gjk3u...
#DataViz #Netflix #Streaming
30.07.2025 10:27 — 👍 5 🔁 2 💬 1 📌 0
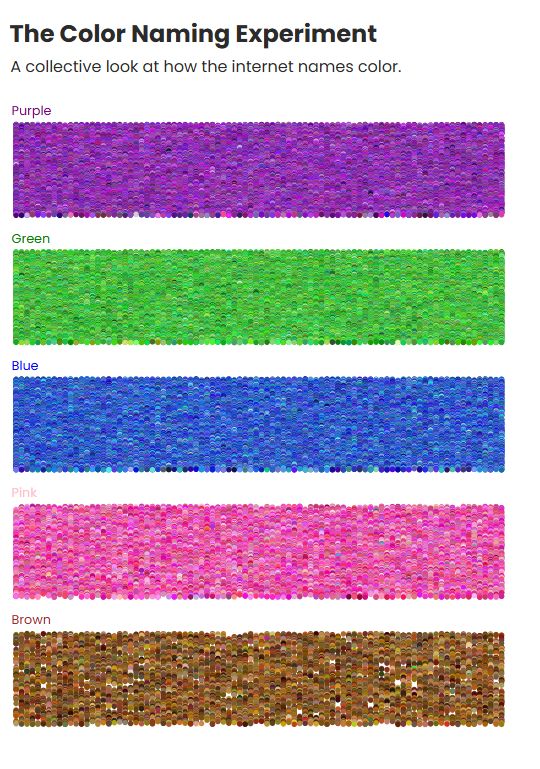
the color naming experiment
🌈 What happens when thousands of internet users name colors?
This week for #TidyTuesday, I charted the chaos (and charm) of the xkcd color survey.
🔵🟢🟣 Each dot is a color someone called “blue”, “green”, “purple”...
Made with #Graphane:
playground.graphane.dev/editor/gurzt...
#DataViz #Color
09.07.2025 10:43 — 👍 18 🔁 0 💬 0 📌 0
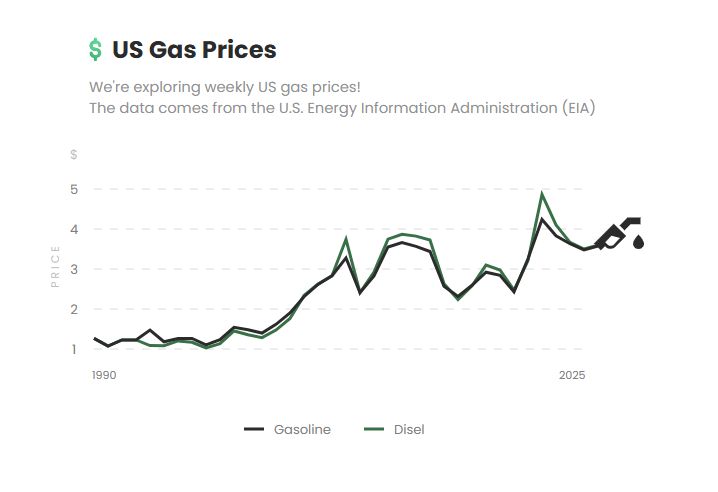
⛽US Gas Prices
For this week’s #TidyTuesday, I visualized annual average fuel prices in the US from 1990 to 2025.
📈Each line shows how gas and diesel prices changed — shaped by economics, events, and policy.
Visual made with #Graphane:
playground.graphane.dev/editor/gjz5x...
#DataViz #FuelPrices
02.07.2025 10:49 — 👍 9 🔁 0 💬 1 📌 0
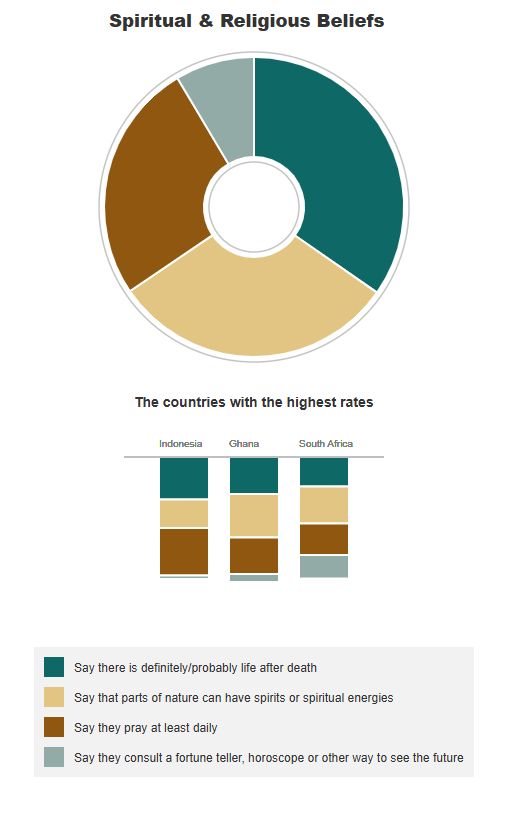
🌀Spiritual Beliefs Around the World
For this week’s #MakeoverMonday, I visualized how religions across countries connect with:
life after death, daily prayer, nature's energy, and fortune telling.
Visual built with #Graphane:
playground.graphane.dev/editor/ggof9...
#DataViz #Spirituality #Religions
01.07.2025 12:12 — 👍 0 🔁 0 💬 0 📌 0
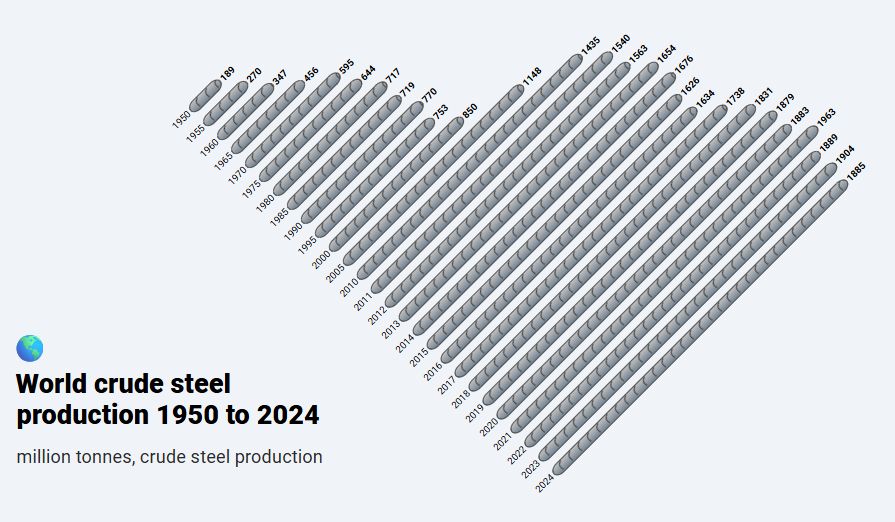
World crude steel
production 1950 to 2024
million tonnes, crude steel production
🔩📊World Crude Steel Production
For this week’s #MakeoverMonday,
To add a special visual touch, I represented the bars as real steel bars, where the length of each reflects the tons produced per year.
Visual made with #Graphane:
playground.graphane.dev/editor/g5pv6...
#DataViz #SteelProduction
10.06.2025 15:59 — 👍 3 🔁 0 💬 0 📌 0
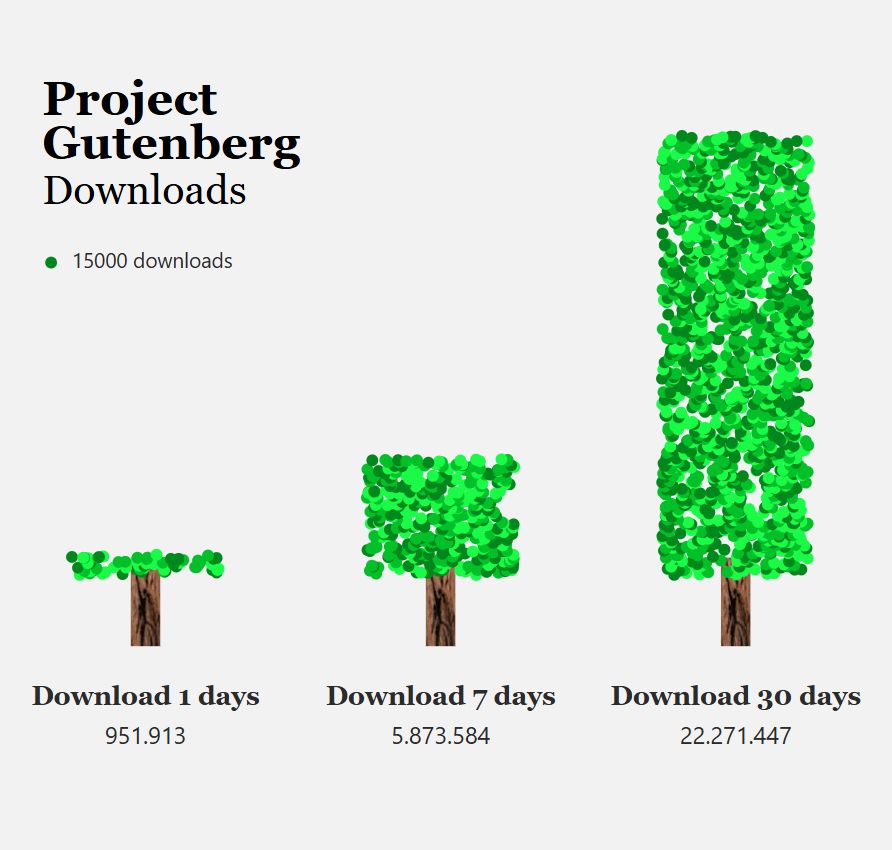
Project Gutenberg Downloads
📚 Project Gutenberg Downloads
For this week’s #TidyTuesday, I visualized downloads over 1, 7, and 30 days.
Each tree shows a span — each leaf a download.
🌳A growing forest for every paper book we didn’t need to print.
Visual made with #Graphane:
playground.graphane.dev/editor/g621m...
#DataViz
03.06.2025 08:18 — 👍 4 🔁 0 💬 0 📌 0
🎲 Dungeons & Dragons: Who Can Take It and Who Dishes It Out?
For this week’s #TidyTuesday, I made Scatter plot of HP vs. total damage per character.
The Tarrasque dominates in HP, the Solar in damage.
Visual made with #Graphane:
playground.graphane.dev/editor/g5q1x...
#DataViz
28.05.2025 08:42 — 👍 15 🔁 1 💬 0 📌 0
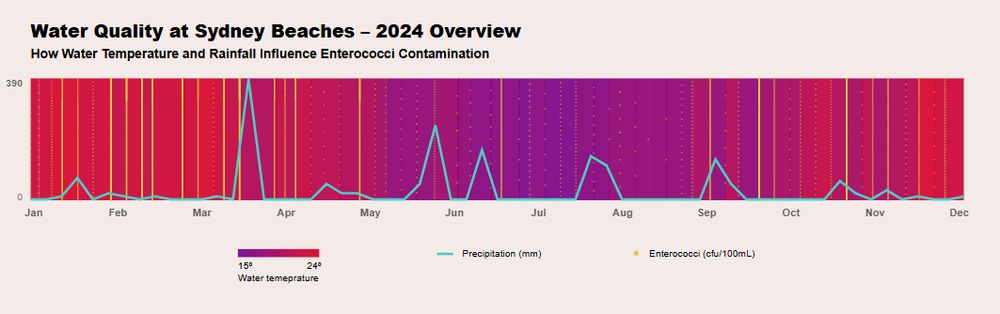
Water Quality at Sydney Beaches - 2024 Overview
🌊 Water Quality at Sydney Beaches
For this week’s #TidyTuesday, I explored how water temperature and rainfall influence enterococci contamination in 2024.
Visual made with #Graphane:
playground.graphane.dev/editor/gcatt...
#DataViz
20.05.2025 07:42 — 👍 5 🔁 1 💬 0 📌 0
🌋 Seismic Events at Mount Vesuvius
For this week’s #TidyTuesday, I visualized seismic depths from 2013–2024.
Each circle shows an event, with its size reflecting how far the shockwave could spread from the epicenter.
You can see this in #Graphane:
playground.graphane.dev/editor/gazn7...
#DataViz
13.05.2025 08:32 — 👍 11 🔁 2 💬 1 📌 0
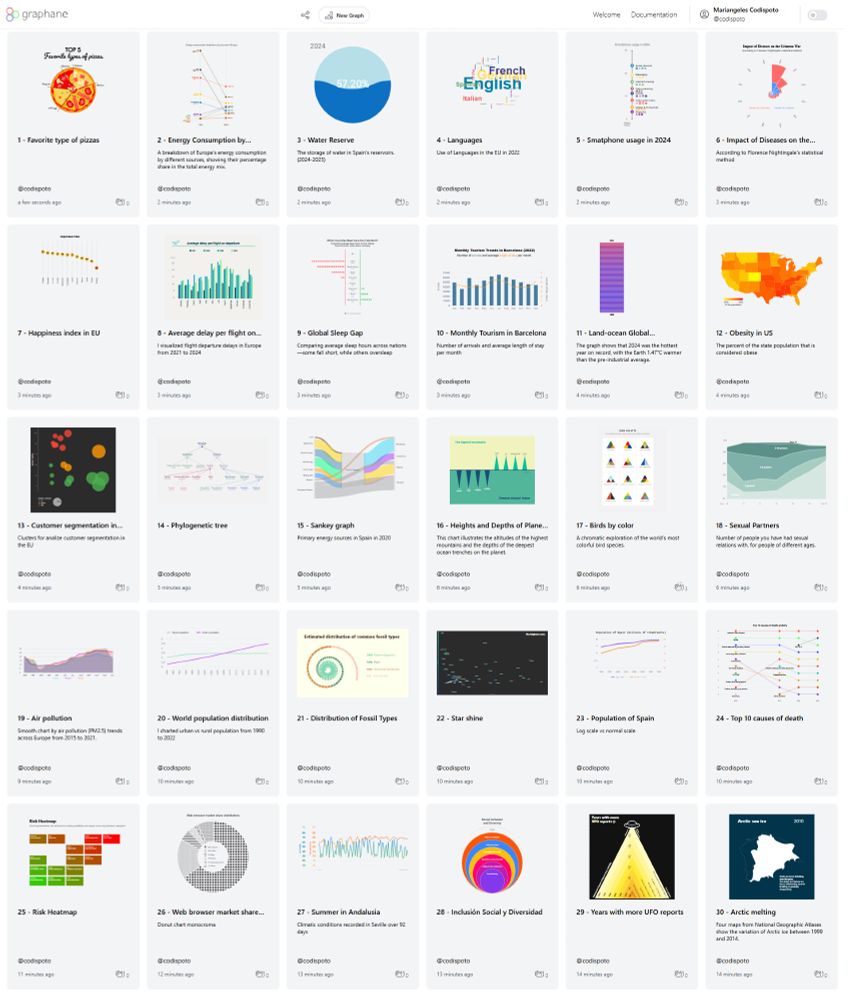
30 charts
📈📅30 charts in 30 days.
A month of exploring stories through data.
Grateful for the ride — and for everyone who followed along.
Big thanks to #Graphane for being the canvas behind every chart. 📊🖤
You can see it in my gallery:
playground.graphane.dev/gallery/@cod...
#30DayChartChallenge #DataViz
30.04.2025 11:04 — 👍 16 🔁 3 💬 0 📌 0
Day 30 of the #30DayChartChallenge! 📊
Today's theme: National Geographic 🌍
I traced the vanishing path of Arctic sea ice, 1999–2014.
Once perennial, now ephemeral.
Based on a National Geographic article.
#DataViz #Graphane #ClimateCrisis
See it here:
playground.graphane.dev/editor/ggvdl...
30.04.2025 09:42 — 👍 2 🔁 2 💬 0 📌 0
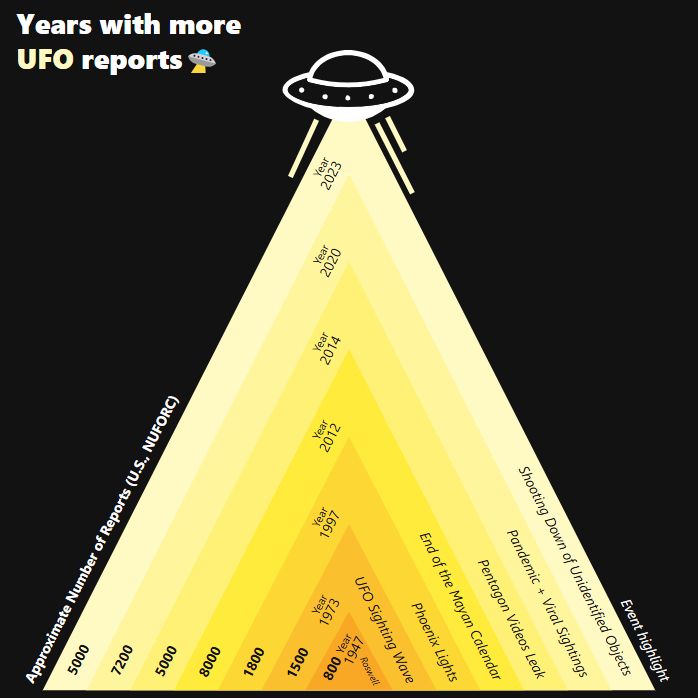
Years whit more UFO reports
Day 29 of the #30DayChartChallenge! 👽
Today's theme: Extraterrestrial 🛸
A timeline of Earth’s most UFO-obsessed years, based on real sighting reports.
Turns out the skies get busier when the world gets weirder.
#DataViz #Charts #Graphane #UFO
See it here:
playground.graphane.dev/editor/gj9xw...
29.04.2025 13:13 — 👍 8 🔁 4 💬 0 📌 0
Day 28 of the #30DayChartChallenge! 📊
Today's theme: #Inclusion 🫶
From the self to society —
A journey across 6 layers of inclusion.
Social inclusion isn't a single circle — it's a system.
#DataViz #Charts #Graphane
See it here:
playground.graphane.dev/editor/g0otm...
28.04.2025 08:29 — 👍 6 🔁 2 💬 0 📌 0
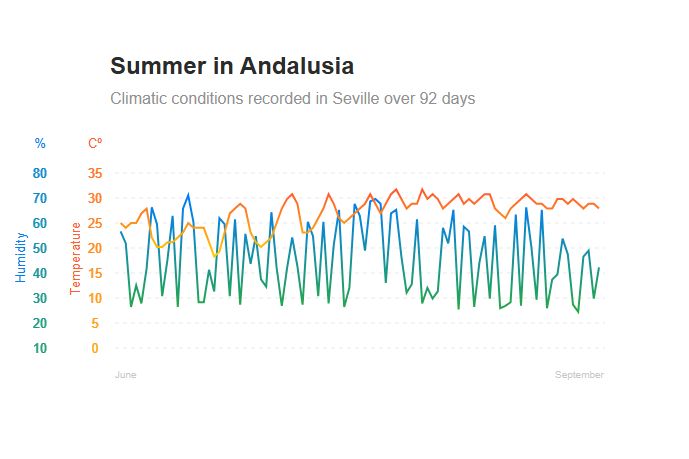
Summer in Andalusia
Day 27 of the #30DayChartChallenge! 📊
Today's theme: Noise 🌡️💦
Summer in Andalusia.
92 days of temperature and humidity recorded in Seville — patterns shaped by heatwaves and moisture shifts.
#DataViz #Charts #Graphane
See it here:
playground.graphane.dev/editor/go6k9...
27.04.2025 11:01 — 👍 6 🔁 2 💬 0 📌 0
Back then, we filled spaces with simple patterns; now we need a full 4K production to achieve the same effect. Those were the days!
27.04.2025 10:59 — 👍 3 🔁 0 💬 0 📌 0
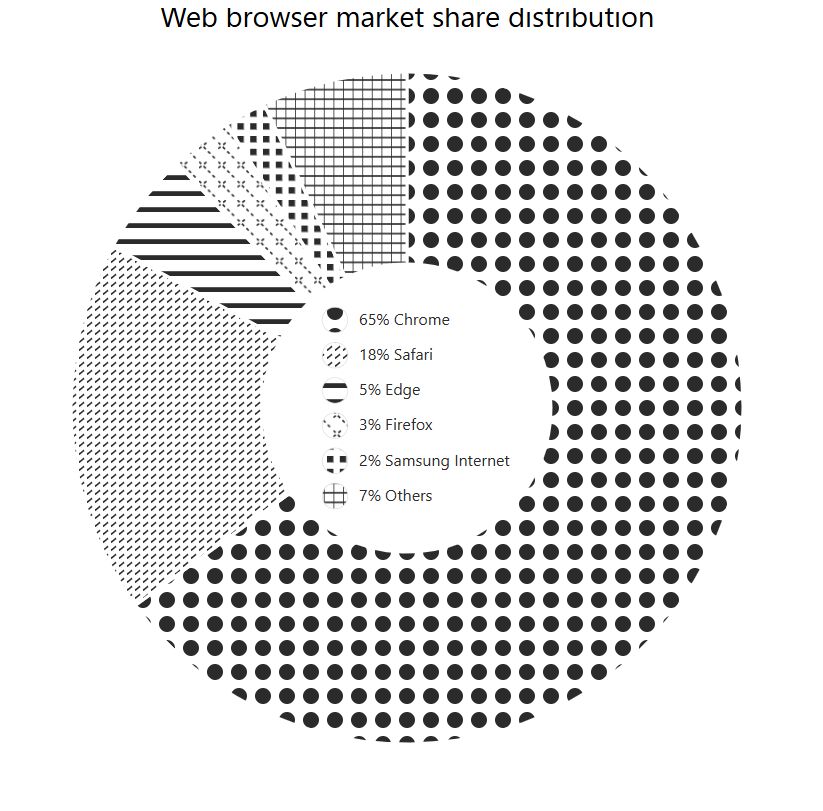
Web browser market share distribution
Day 26 of the #30DayChartChallenge! 📊
Today's theme: Monochrome ⚫⚪
A black & white donut chart, with old-school style, showing who’s winning the browser wars. Chrome takes the bite, but others still have a slice.
#DataViz #Charts #Graphane
See it here:
playground.graphane.dev/editor/gkrw3...
26.04.2025 11:23 — 👍 7 🔁 4 💬 1 📌 0
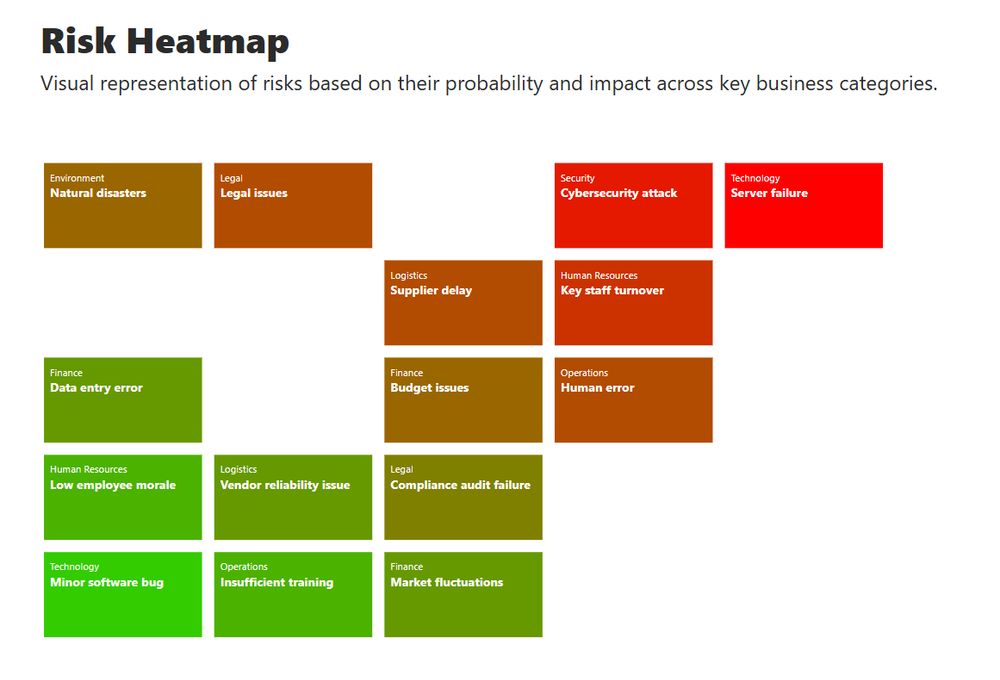
Risk Heatmap
Day 25 of the #30DayChartChallenge! 📊
Today's theme: Risk ⚠️
Visualized business risks by probability and impact —
a heatmap of what could go wrong, and how bad it could be.
#DataViz #Charts #Graphane
See it here:
playground.graphane.dev/editor/gvi5x...
25.04.2025 09:05 — 👍 4 🔁 2 💬 0 📌 0
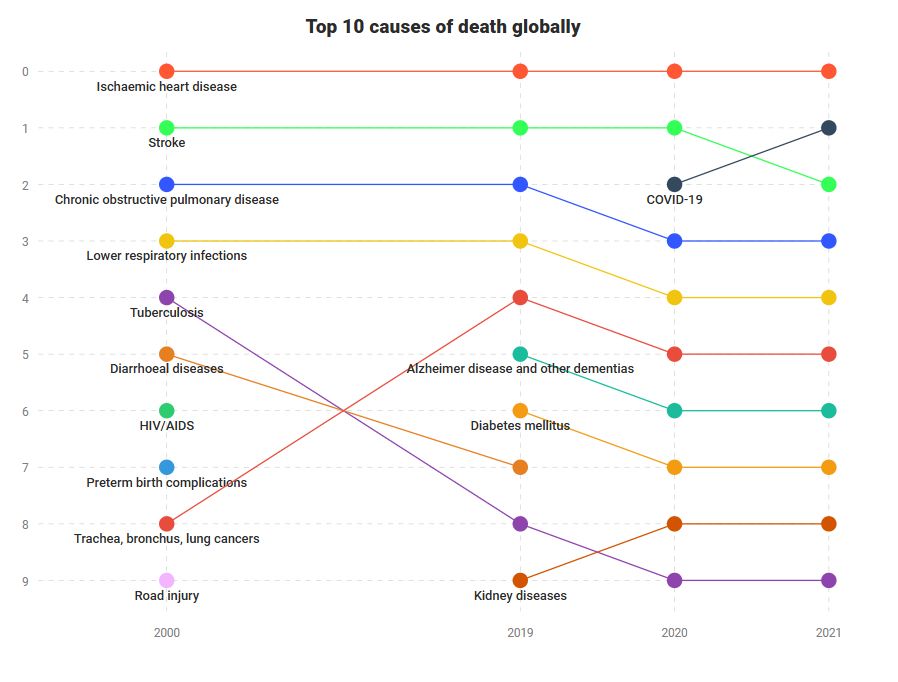
Top 10 causes of death globally
Day 24 of the #30DayChartChallenge! 📊
Theme: Data Day: WHO⚕️
How the end shifts over time.
Top 10 causes of death from 2000 to 2021 —
some diseases fade, others take their place.
#DataViz #Charts #Graphane #WHO #Health
See it here:
playground.graphane.dev/editor/gmfut...
24.04.2025 07:35 — 👍 10 🔁 3 💬 0 📌 0
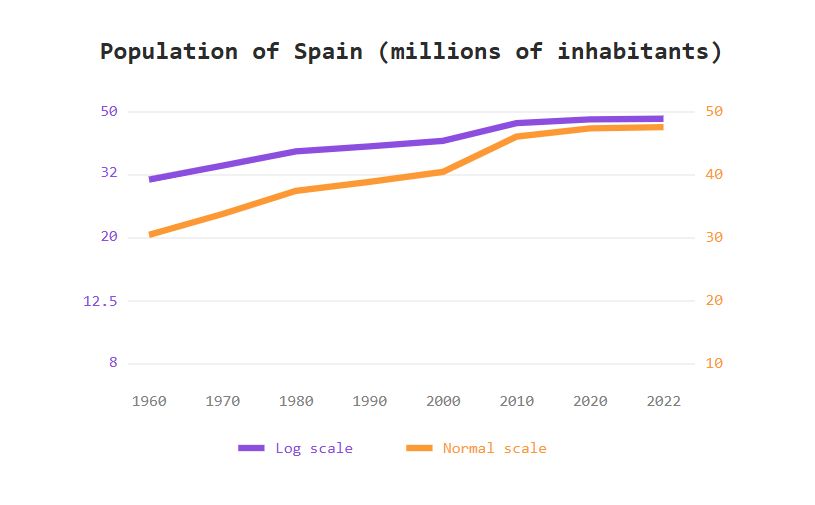
Spain’s population
Day 23 of the #30DayChartChallenge! 📊
Today's theme: Log Scales 📈
Same data, two views.
Spain’s population (1960–2022) —
one line linear, one logarithmic.
Growth feels different when perception shifts.
#DataViz #Charts #Graphane #Spain
See it here:
playground.graphane.dev/editor/gku93...
23.04.2025 10:33 — 👍 7 🔁 3 💬 0 📌 0
Day 22 of the #30DayChartChallenge! 📊
Today's theme: Stars ⭐
Not all that glitters is close.
This chart plots the brightest stars in our sky —
Some shine nearby, others burn far away. ✨
#DataViz #Charts #Graphane #Astronomy #Stars
See it here:
playground.graphane.dev/editor/gm3xm...
22.04.2025 11:20 — 👍 9 🔁 3 💬 0 📌 0
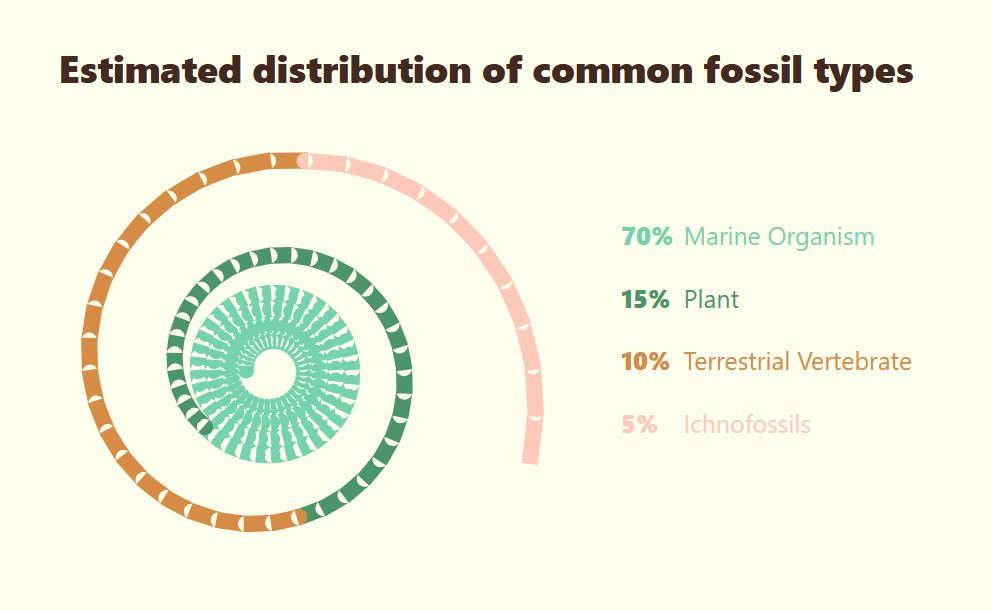
Distribution of common fossil types
Day 21 of the #30DayChartChallenge! 📊
Today's theme: Fossil 🦴🌀
I created a spiral chart showing the types of fossils found —
marine life dominates, while traces and vertebrates are rare relics.
#DataViz #Charts #Graphane
See it here:
playground.graphane.dev/editor/gn41m...
21.04.2025 14:15 — 👍 8 🔁 3 💬 0 📌 0
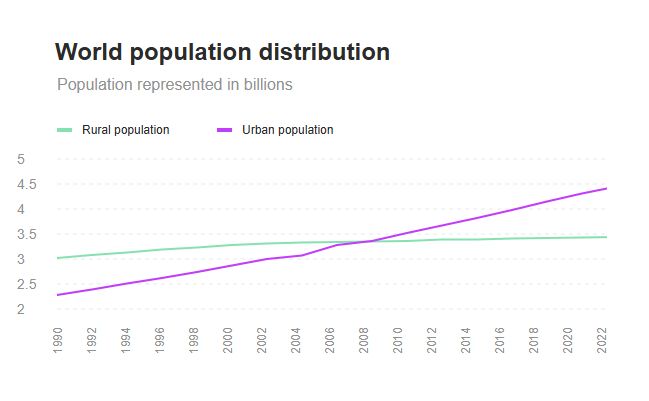
World population distribution
Day 20 of the #30DayChartChallenge! 📊
Today's theme: Urbanization 🌆🌾
I charted urban vs rural population from 1990 to 2022 —
a steady climb for rural areas, but cities are growing much faster.
#DataViz #Charts #Graphane
See it here:
playground.graphane.dev/editor/ghq08...
20.04.2025 10:56 — 👍 7 🔁 3 💬 0 📌 0
I found it in 'el pais'. But the data is from the CIS: www.cis.es/documents/d/...
20.04.2025 10:48 — 👍 2 🔁 0 💬 0 📌 0
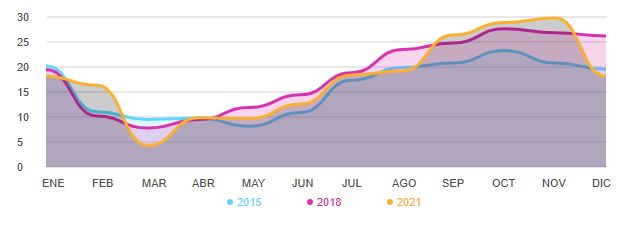
PM2.5 air pollution trends
Day 19 of the #30DayChartChallenge! 📊
Today's theme: Smooth 🌫️
I visualized PM2.5 air pollution trends across Europe from 2015 to 2021. 🌍💨
The data shows a clear seasonal rhythm:
PM2.5 ↓☀️summer, ↑❄️winter
#DataViz #Charts #Graphane
See it here:
playground.graphane.dev/editor/glyw5...
19.04.2025 10:56 — 👍 11 🔁 3 💬 0 📌 0
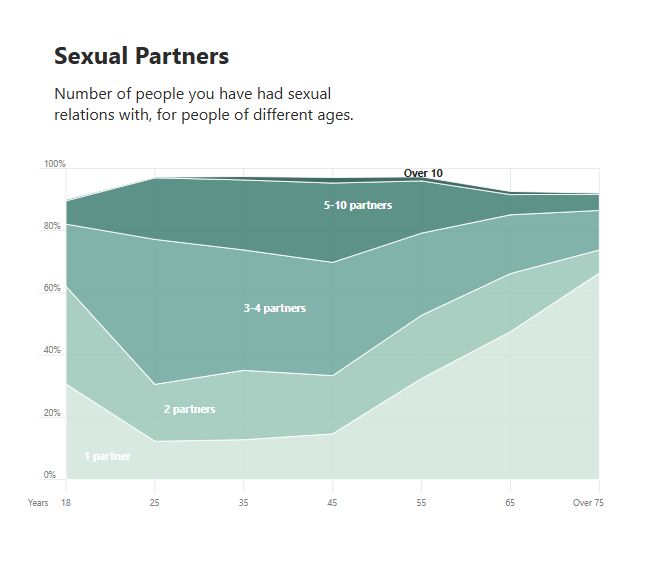
Sexual Partners
Day 18 of the #30DayChartChallenge! 📊
Today's theme: El País
I recreated a chart by Kiko Llaneras from El País.💌
Showing how the number of sexual partners varies across ages. Soft stacked areas to reveal shifting norms.
#DataViz #Charts #Graphane
See it here:
playground.graphane.dev/editor/g26cr...
18.04.2025 08:20 — 👍 12 🔁 4 💬 1 📌 0
Thank you so much! Really glad you enjoyed it — you're totally right, Paradisea rubra has such a unique elegance. I’ll definitely look more into it. And yes — the Himalayan Monal is an absolute stunner, a true jewel bird! Appreciate your thoughts
18.04.2025 08:17 — 👍 1 🔁 0 💬 0 📌 0
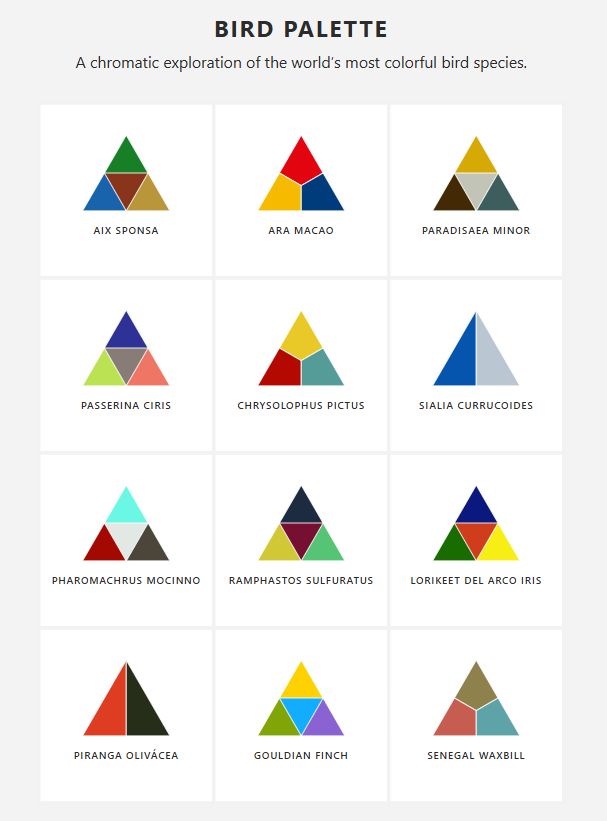
Bird palette
Day 17 of the #30DayChartChallenge! 📊
Today's theme: Birds 🐦✨
I turned plumage into palette 🎨 —
each triangle a feather, each square a species.
Nature’s own design system.
#DataViz #Charts #Graphane #Colors
See it here:
playground.graphane.dev/editor/gboz9...
17.04.2025 07:41 — 👍 45 🔁 9 💬 2 📌 0
Data Analyst, Shanghai
I explore how meaning emerges when humans shape the world through language, symbols, and thought—from ancient Chinese characters to data visuals to cognitive models of mind and machine.
Posit DS Hangout host & data educator. Data Weasel. Community Builder. Teaches R+Python.
🔉 Heeren == "hair-en" ✨
LinkedIn: https://www.linkedin.com/in/libbyheeren
DS Hangout: https://pos.it/dsh
🧙♂️✨📊
Independent Data Visualization Designer, Consultant & Instructor | available for projects and workshops
All things data & design with #rstats, #ggplot2, #Figma, #DataWrapper, #Flourish, and more
Co-Founder of the #30DayChartChallenge
Agency for Nature and Forests, nature protection and policy. Belief in independent science. Nature and wildlife photographer with a heart for the less known creatures. Trying to promote and protect the animals by showing their beauty. Birds Beetles Bonkers
El vivo al bollo y el muerto al horno
Dataviz designer, psychiatrist, PhD
https://karaman.is
A #DataViz challenge 📊 by @cedricscherer.com and @drxeo.eu
Supported by @wendyshijia.bsky.social and @ansgarw.bsky.social
More info on Github: https://github.com/30DayChartChallenge/Edition2024
𝐓𝐡𝐞 𝐞𝐲𝐞 𝐨𝐟 𝐭𝐡𝐞 𝐰𝐨𝐫𝐥𝐝.
🔎 Keep exploring → civixplorer.com
🗺️ Get your 3D relief map (𝟭𝟬% 𝗼𝗳𝗳) → www.3dmap.cc/coupon_civixplorer
Spatial Data Scientist • Artist • Economist | #ClimateRisk #Dataviz #Maps #DigitalArt #3D in London | X: Julian_H0ffmann
Portfolio: https://www.julian-hoffmann-anton.com/
Science, visualization and communication +scifi enthusiast. 3D modeling & animation using Houdini as main tool. Research engineer at @physmedparis.bsky.social - INSERM. #dataviz #scicomm #sciart
I am doing also commissioned work: https://www.sci-vis-com.fr
GIS and Cartography at Eurostat.
Exploring new ways of making maps.
observablehq.com/@joewdavies
Visual journalist and engineer at Axios. Builder of websites, data visualizations, and pixel cats. She/her.
Scientist and software developer. Creator of tidyplots.org. Website jbengler.de.
👾Data journalist, programmer, sleeper at miraidata.es
👩🏻🏫Teaching Statistics at @UABBarcelona #rstats
My name is Jorge Camões, I'm a #dataviz consultant, trainer, and author of the book Data at Work amzn.to/2i7Z0KO. #Excel, #PowerBI & #PowerQuery, #Tableau. Based in Lisbon, European Union. wisevis.eu
📊 Data visualisation specialist.
💻 #RStats | #Python | #D3.
🎨 Generative artist.
🏃♀️ Runner.
Website: https://nrennie.rbind.io/
She/her. Views my own.
-Mapping the world- Dr. in Physical Geography | environmental health - bioclimatology - geography. RC Researcher from 🇩🇪 at @mbgcsic.bsky.social @csic.es in 🇪🇸 #rstats #dataviz
Secretary of the @aeclim.org
📍Galicia
ℹ️ https://dominicroye.github.io
Data Analyst & Science Lead at the Atlas of Living Australia | Evolutionary biologist & social psychologist (PhD) 🧪 | #rstats 📊 | Music enthusiast 🎵
www.daxkellie.com
Opinions are my own, and they do not express those of my employer