NEW: The White House's Office of Management and Budget has a new chief statistician overseeing the Census Bureau & other federal statistical agencies, according to StatsPolicy.gov. Stuart Levenbach has replaced Mark Calabria, according to the website's "About Us" page
statspolicy.gov/about/#members
23.01.2026 23:16 —
👍 80
🔁 35
💬 6
📌 3

Currently, 6.1 percent of K-12 students in the United States receive gifted education. Using education and IRS data that provide information on students and their family income, we show pronounced differences in who schools identify as gifted across the distribution of family income. Under 4 percent of students in the lowest income percentile are identified as gifted, compared with 20 percent of those in the top income percentile. Income-based differences persist after accounting for student test scores and exist across students of different sexes and racial/ethnic groups, underscoring the importance of family resources for gifted identification in schools.

Notes. Identification rates are regression-adjusted means by income percentile (or ventile) estimated with models controlling for a linear trend in year. Panel A includes controls for sex and race/ethnicity. Panel B includes controls for grade and race/ethnicity. Panel C includes controls for grade and sex. Models are run separately by subgroup. Abbreviations are as follows: AIAN is American Indian/Alaska Native; API is Asian/Pacific Islander. DRB approval number: CBDRB-FY25-0309.
Students from families in the top income percentile are more than 5 times as likely to be identified for gifted programs as students from the bottom percentile.
20.12.2025 15:53 —
👍 4
🔁 1
💬 0
📌 1

Gifted Identification Across the Distribution of Family Income
Students from families in the top income percentile are more than 5 times as likely to be identified for gifted programs as students from the bottom percentile.
New CES Working Paper: "Gifted Identification Across the Distribution of Family Income" by Ainsworth, Ainsworth, Cleveland, Clark, Brummet, Penner, Hibel, Saultz, Spiegel, Hanselman, and Penner
www.census.gov/library/work...
20.12.2025 15:50 —
👍 10
🔁 3
💬 1
📌 1

Currently, 18 percent of K-12 students in the United States receive additional supports through the identification of a disability. Socioeconomic status is viewed as central to understanding who gets identified as having a disability, yet limited large-scale evidence examines how disability identification varies for students from different income backgrounds. Using unique data linking information on Oregon students and their family income, we document pronounced incomebased differences in how students are categorized for two school-based disability supports: special education services and Section 504 plans. We find that a quarter of students in the lowest income percentile receive supports through special education, compared with less than seven percent of students in the top income percentile. This pattern may partially reflect differences in underlying disability-related needs caused by poverty. However, we find the opposite pattern for 504 plans, where students in the top income percentiles are two times more likely to receive 504 plan supports. We further document substantial variation in these income-based differences by disability category, by race/ethnicity, and by grade level. Together, these patterns suggest that disability-related needs alone cannot account for the income-based differences that we observe and highlight the complex ways that income shapes the school and family processes that lead to variability in disability classification and services.

Notes. “Overall” identification rates are regression-adjusted means by income percentile estimated with models controlling for race/ethnicity, sex, grade, and a linear trend in year. “Within school” estimates come from models incorporating school fixed effects. DRB approval number: CBDRB-FY25-0309.
Family income shapes school disability supports: high-income students receive more 504 accommodations and low-income students more special education services.
20.12.2025 15:59 —
👍 4
🔁 1
💬 0
📌 1
School-Based Disability Identification Varies by Student Family Income
Family income shapes school disability supports: high-income students receive more 504 accommodations and low-income students more special education services.
New CES Working Paper: "School-Based Disability Identification Varies by Student Family Income" by Ainsworth, Cleveland, Clark, Hibel, Brummet, Saultz, Penner, Spiegel, Yoo, Cristancho, Hanselman, and Penner www.census.gov/library/work...
20.12.2025 15:57 —
👍 7
🔁 2
💬 1
📌 0

New in print: In MS counties w/ higher % Black students, white policymakers were less likely to access Equalization funds. Exploiting variation in school spending induced by this so-called equalization policy, we document a tragedy in racist public policy. www.sciencedirect.com/science/arti...
28.11.2025 17:54 —
👍 2
🔁 3
💬 0
📌 0
Every mention of SNAP being frozen should include this simple fact:
TRUMP is CHOOSING TO CANCEL FOOD ASSISTANCE. There are literally emergency dollars available to keep SNAP funded.
27.10.2025 23:23 —
👍 1972
🔁 996
💬 49
📌 31
ICYMI...
28.10.2025 14:17 —
👍 0
🔁 1
💬 0
📌 0

New research from PSC researcher @pgonalon.bsky.social with @imarinescu.bsky.social shows that the high cost of U.S. childcare breeds family income inequality.
Learn more in OMNIA: bit.ly/48W3iOT
Read the study in American Sociological Review:
bit.ly/4h60nVY
14.10.2025 13:18 —
👍 2
🔁 1
💬 0
📌 1

Trump Fires Black Officials From an Overwhelmingly White Administration
A loud reminder that this administration wants to bring back SEGREGATION as @victorerikray.bsky.social has pointed out and they're starting within the administration.
A literal page out of Woodrow Wilson's playbook. #blacksky #news
09.10.2025 11:43 —
👍 124
🔁 46
💬 1
📌 3

census.gov Notification
Due to the lapse of federal funding, portions of this website are not being updated. Any inquiries submitted via www.census.gov will not be answered until appropriations are enacted.
NEW: The Census Bureau says parts of its website are not being updated because of the federal government shutdown and questions from data users will not be answered "until appropriations are enacted"
01.10.2025 19:20 —
👍 22
🔁 10
💬 1
📌 0
Yeah, honestly: “parental rights” are starting to sound more like “property rights.”
02.09.2025 18:11 —
👍 1001
🔁 125
💬 36
📌 26
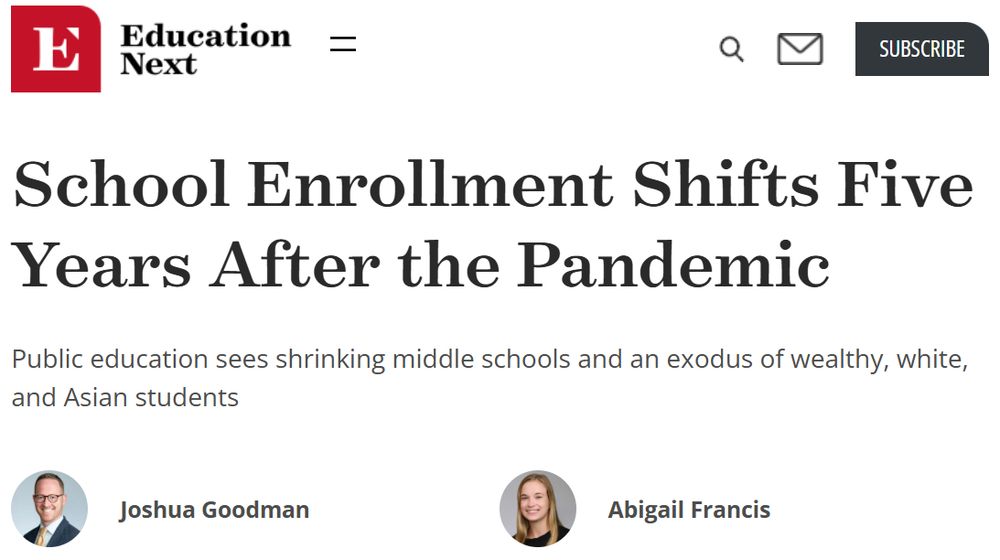
Want to know how the pandemic has reshaped school enrollment patterns in Massachusetts and nationwide?
Here's Education Next's quick and accessible version of our recent working paper:
www.educationnext.org/school-enrol...
@abbyfrancis.bsky.social @educationnext.bsky.social
22.07.2025 13:41 —
👍 15
🔁 5
💬 2
📌 0
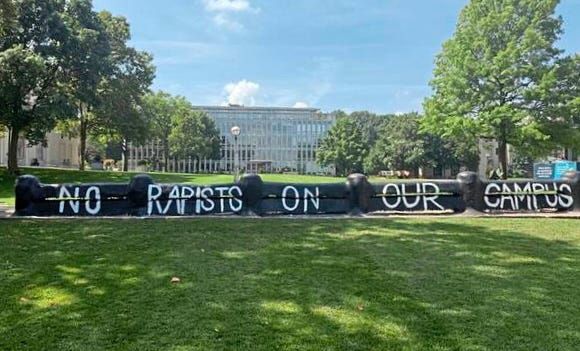
Who is disgracing whom?
There is a Fence located on the central green space of our Carnegie Mellon University campus on which, for more than 100 years, CMU…
Carnegie Mellon University leaders silenced @cmu.edu students who called Trump a rapist claiming they violated civil discourse. I wrote about the disgrace of reprimanding students for rejecting the idea that our campus is a place to engage in civil discourse with rapists. medium.com/@ujuanya/who...
22.07.2025 13:17 —
👍 18
🔁 5
💬 1
📌 0
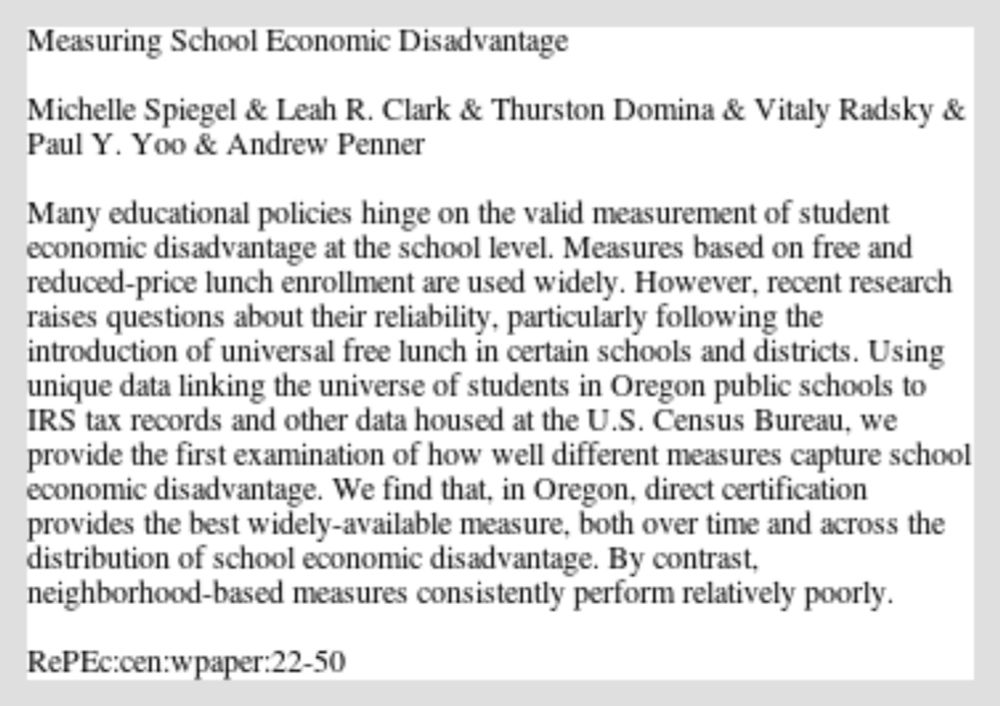
Unfortunately, direct certification-based measures are not widely available yet. We find no easy solutions to measuring school/student economic disadvantage using publicly-available data, and discuss more in this book chapter: books.google.com/books?hl=en&...
19.06.2025 12:12 —
👍 1
🔁 1
💬 0
📌 0

Trump Wants to Cut More Than 40 Federal K-12 Programs. See Which Ones
The president's detailed budget, released Friday, proposes eliminating dozens of programs as part of a nearly $13 billion cut.
The White House wants to axe funding programs for:
-English learners
-Homeless students
-Migrant students
-Teacher PD
-Civics ed.
-Literacy
-Arts ed.
-Preschoolers with disabilities
-Adult learners
-Rural schools
-School desegregation
-Alaska/Hawaii Native students
www.edweek.org/policy-polit...
05.06.2025 17:40 —
👍 1
🔁 4
💬 0
📌 0
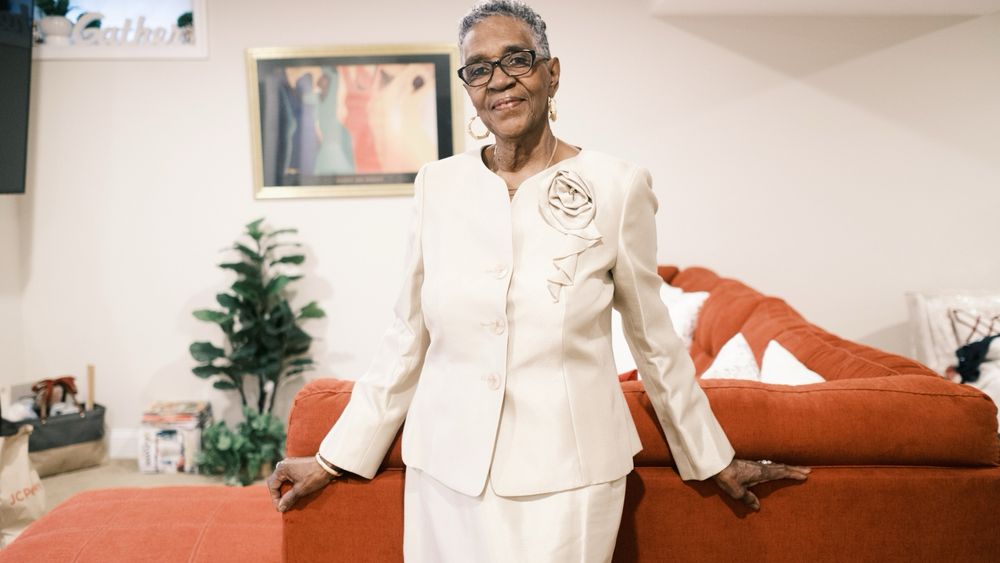
Federal work shaped a Black middle class. Now it's destabilized by Trump's job cuts
For generations of Black workers, federal government jobs have provided a path into the middle class. The Trump administration's workforce cuts are now throwing that sense of stability up in the air.
My latest @npr.org story with Marisa Peñaloza, Kyna Uwaeme and Brent Jones:
For generations of Black workers, federal government jobs have provided a path into the middle class. The Trump administration’s workforce cuts are now throwing that sense of stability up in the air
27.04.2025 10:08 —
👍 268
🔁 79
💬 5
📌 9
Looking for one more paper for the APPAM panel Josh describes here. Please reach out if you have a paper that might fit!
15.04.2025 21:10 —
👍 5
🔁 3
💬 0
📌 0
A couple of us are putting together an APPAM panel on post-pandemic school enrollment/access patterns, broadly conceived.
Let me know if you or someone you know has a paper that might fit this theme.
14.04.2025 14:24 —
👍 9
🔁 7
💬 2
📌 1
CSWEP DC
Submit papers for two CSWEP sponsored sessions at APPAM next fall. Looking especially for papers on health policy and poverty and income policy, broadly interpreted. Deadline extended to April 15. Pls share!
www.aeaweb.org/about-aea/co...
07.04.2025 16:54 —
👍 2
🔁 2
💬 0
📌 0
So, um, some professional news:
25.03.2025 02:54 —
👍 4
🔁 3
💬 1
📌 0
For more technical details, including how we handle students with missing income, check out the online appendix.
Or bug me, @michspieg.bsky.social, @andrewpenner.bsky.social, @emilykpenner.bsky.social, or @t-h-a-d.bsky.social to discuss further!
23.03.2025 23:17 —
👍 5
🔁 0
💬 1
📌 0
We use the Uneven Exposure Index to compare peer income exposure across classroom and school peer groups, and across grade levels. Sorting across schools–-in parallel with income sorting across neighborhoods and towns–-is the driver of the uneven peer income distributions we document.
23.03.2025 23:14 —
👍 0
🔁 0
💬 1
📌 0
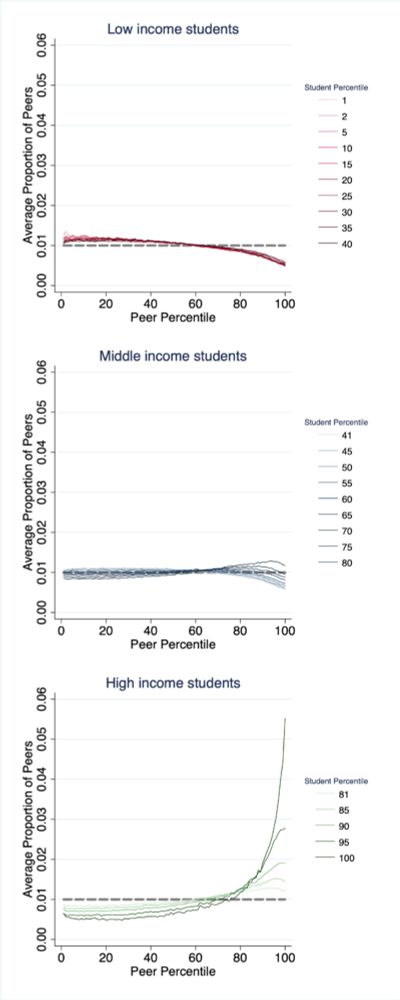
Note that an even average distribution is a necessary-–but not sufficient–-condition for truly even peer income exposure. There are schools, especially in urban settings, with high concentrations of poverty. But there are low-income students everywhere, not just in cities.
23.03.2025 23:14 —
👍 0
🔁 0
💬 1
📌 0
The logic behind the Uneven Exposure Index is that if students were evenly distributed by income, they would have 1% of peers in each percentile. We sum up the distance from the even distribution across all 100 percentiles, and divide by 2 to derive Uneven Exposure.
23.03.2025 23:11 —
👍 0
🔁 0
💬 1
📌 0
While more than one-quarter of very high-income peers, on average, would need to be swapped for peers in lower percentiles to achieve an even distribution for very high-income students, students around the 60th income percentile have remarkably even peer income distributions.
23.03.2025 23:10 —
👍 0
🔁 0
💬 1
📌 0