
Me and the boys watching the global trade war escalate today
08.04.2025 03:36 — 👍 0 🔁 0 💬 0 📌 0
@tom-cui.com.bsky.social
I study how policies and institutions shape housing markets at the NYU Furman Center! All opinions, for better or for worse, are my own
Me and the boys watching the global trade war escalate today
08.04.2025 03:36 — 👍 0 🔁 0 💬 0 📌 0In addition, we could recalculate these estimates just for the Southern states - for now, the only place with any hope of even building in this range.
01.01.2025 19:41 — 👍 1 🔁 0 💬 0 📌 0The more interesting question is where exactly do we want the gap to be, between 6-20M. Just from an urbanist perspective, 20M single-family homes would have enormous land use costs.
01.01.2025 19:41 — 👍 0 🔁 0 💬 1 📌 0This is what you'd need for *the free market to lower prices as much as it can* - for existing homes to be affordable to families with more modest incomes than their earlier buyers!
Furthermore, in this world early buyers are free to access bigger McMansions in the periphery.
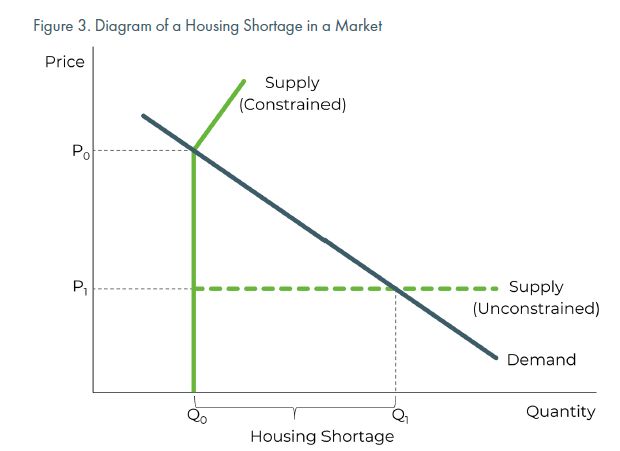
If you make up these 5-6M units, the affordability issue would look less dire for the dual-earner families struggling to buy homes this second.
The Corinth estimate has a different idea of "needed" - what we'd get if free competition drove prices to their construction costs
The key assumptions about how many units are "needed" here is that it maintains past household formation trends, plus constant vacancy rates.
My interpretation of *how prices look* in this assumed world is that house prices keep rising, but *in line with income growth*.
PSA: A lot of the thread is expanding on what Salim Furth (Mercatus) wrote 2 years ago:
marketurbanism.com/2022/08/05/h...
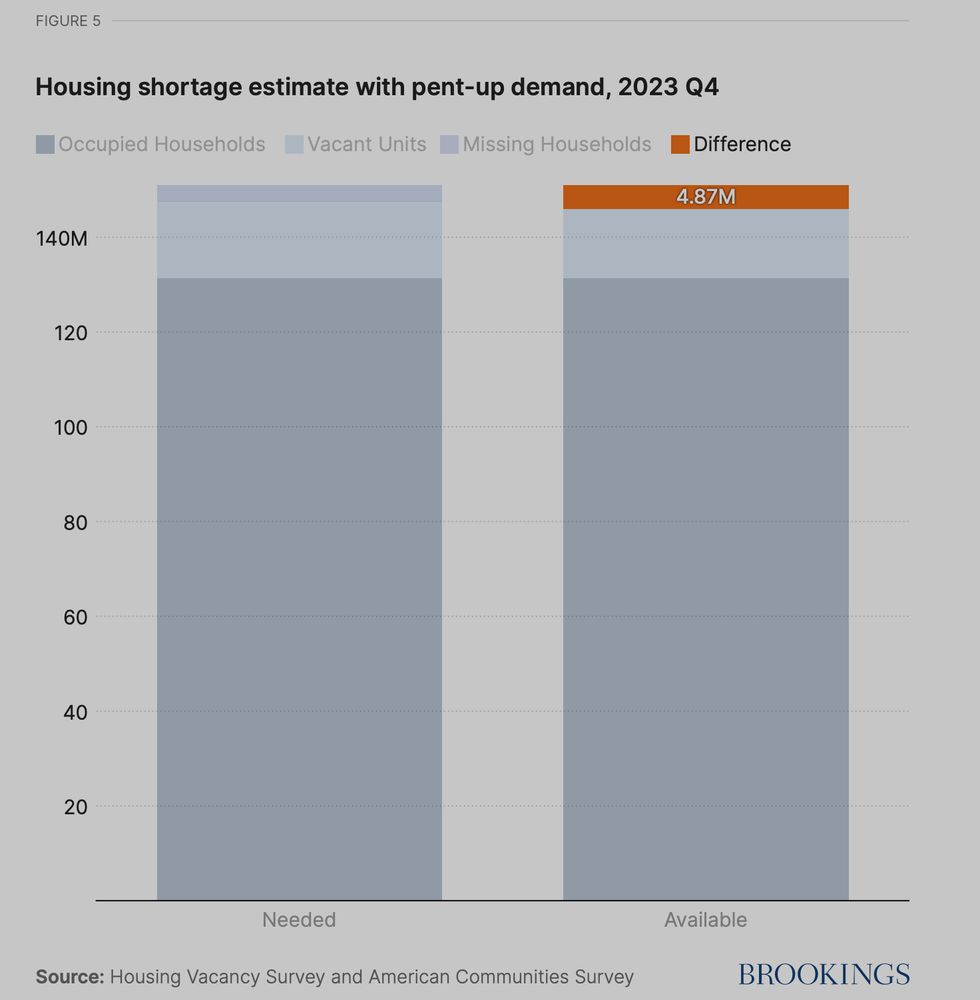
My preferred method is the approach by Khater et al (2021), updated to '23 data recently. So for me, the shortage "snapshot" now is 5-6M units
brookings.edu/articles/mak...
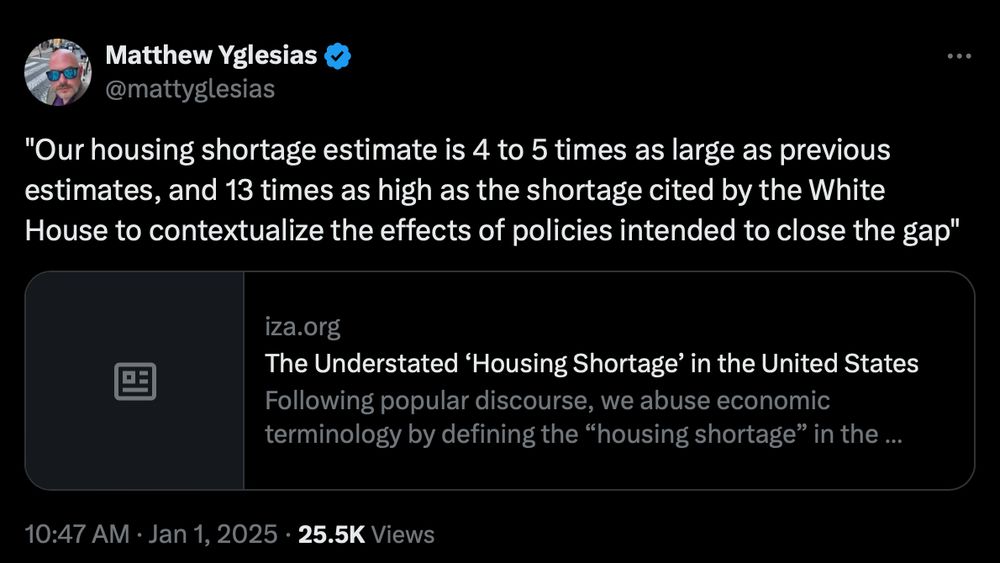
This isn't the first time we've seen the Corinth/Dante estimates of the U.S. housing shortage - 20 million units!
Sounds like a big number, but it's not a crazy number. The magnitude depends on at what point you'd consider the shortage "closed."
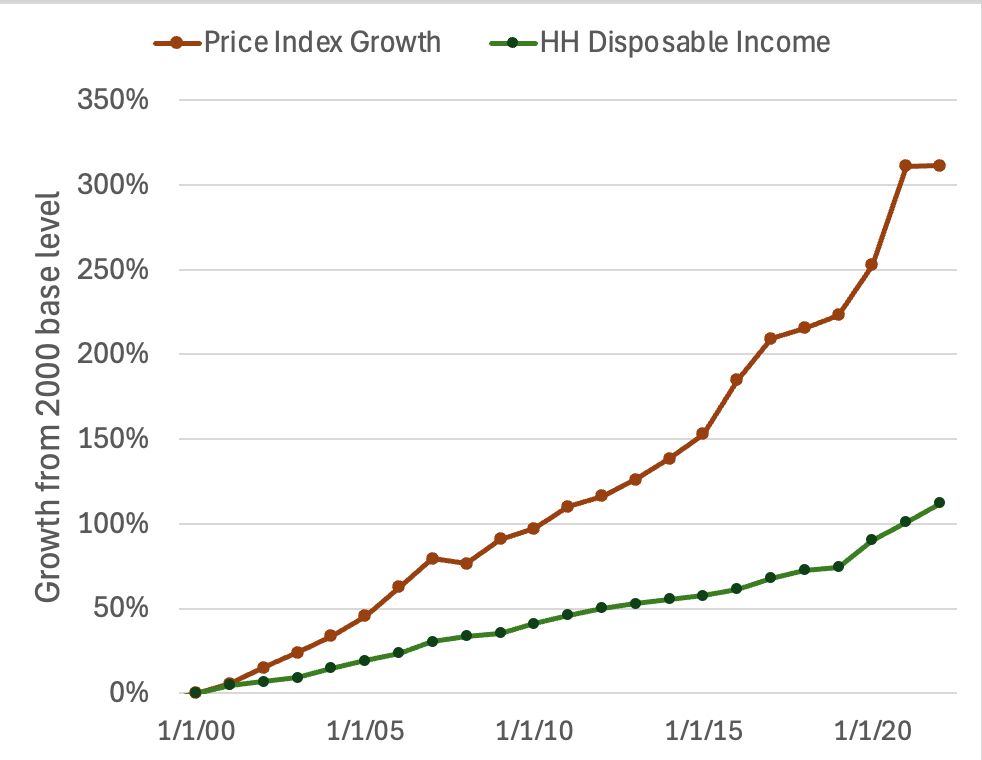
And if I had to make my ideal version of the Canada graph, I'd combine the OECD household data with the Teranet house price index instead.
You can more easily see three "shifts" in the divergence with this anyway: from 2000-2015, 2015-2021 and the post-COVID market.
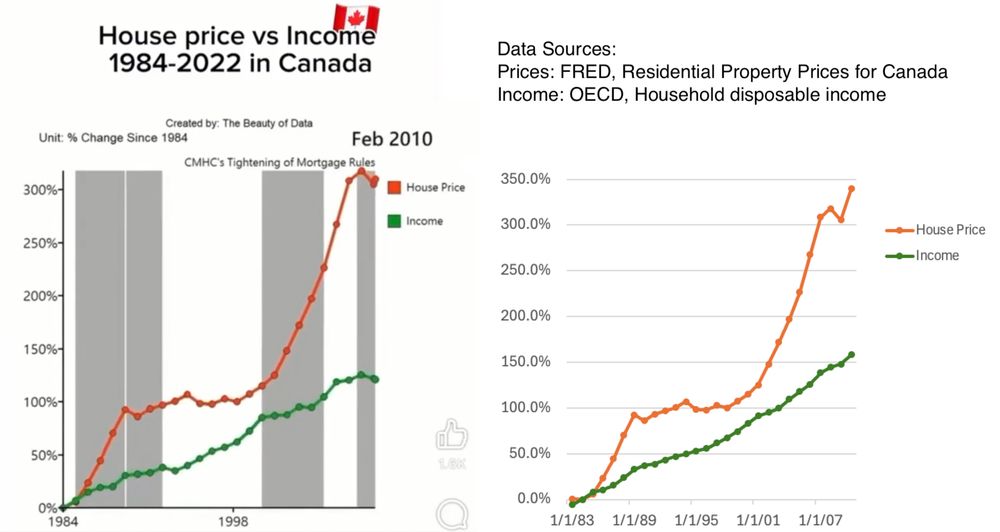
Then I looked for a more proper measure of income for the context: household disposable income, available in a standard form at the OECD.
The trends match better, at least. But growth is still slower than the OECD data source. From 1984-2022, OECD reports 300% change while the video reports 200%
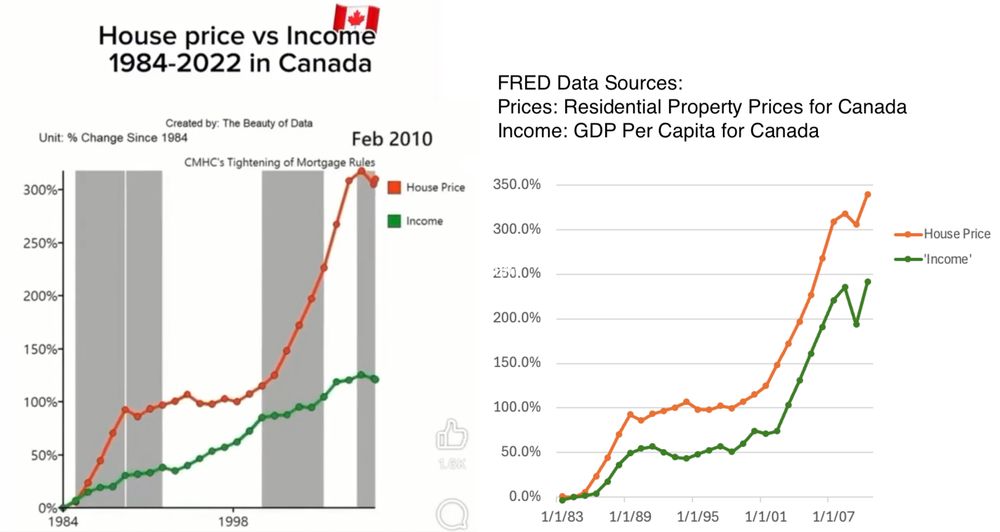
But the trends don't match! Nothing on FRED could replicate the "income" part.
Here is a zoom-in before the (very real) explosion in Canadian house prices in the last 6 years, showing the lack of a match.
The data actually cites the series on fred.stlouisfed.org they use, which is nominal "Residential Property Prices per capita," replicable by fixing an index value.
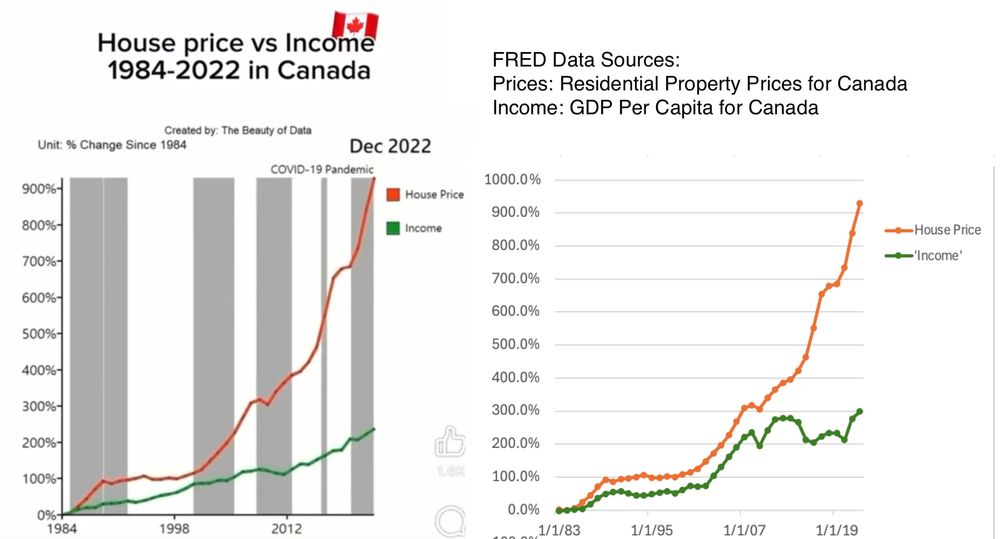
At first I thought maybe they went for the next search result on FRED, which is GDP Per Capita. It's not a measure of "income" either
Here's a viral Tiktok chart on housing unaffordability in Canada, but it looked a bit weird to me.
It's not as bad as when a viral U.S. chart compared rent growth with inflation-adjusted income. But here's my look into what is used as "income" here...
www.tiktok.com/@thebeautyof...
at taking charge of both planning "pockets of density" as well as the transportation infrastructure connecting them together.
16.12.2024 18:36 — 👍 1 🔁 0 💬 0 📌 0Greater London outside of the core are some of the most inelastic parts of the country, with inverse elasticities of 15-20!
I'm not convinced Paris's suburbs are big fans of gentle densification and land subdivision either, but I do think the central government there is more adept
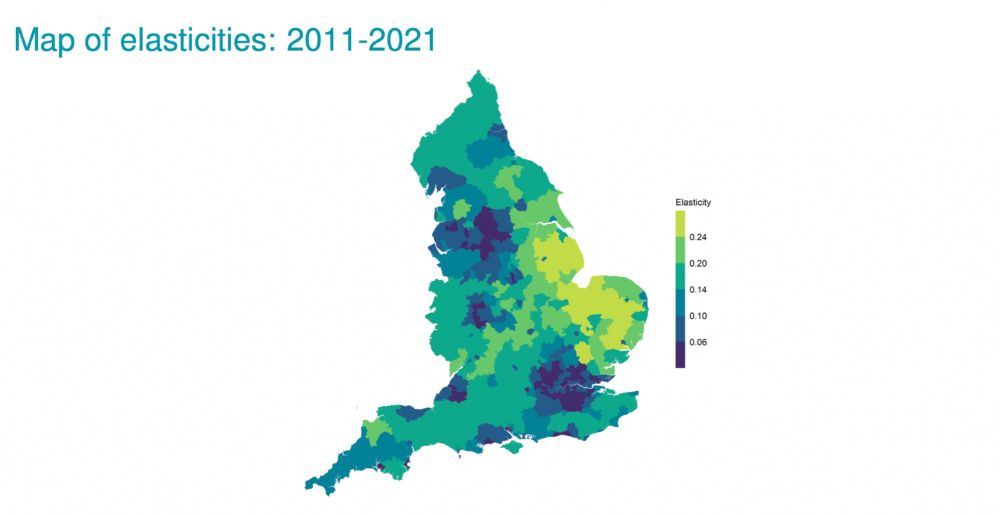
This is a bit beside the point, but for a direct comparison with France I found a project estimating local housing supply elasticities for England too. ifs.org.uk/sites/defaul...
You have to take reciprocal of all numbers here, but even the most elastic parts of England have values >= 4!
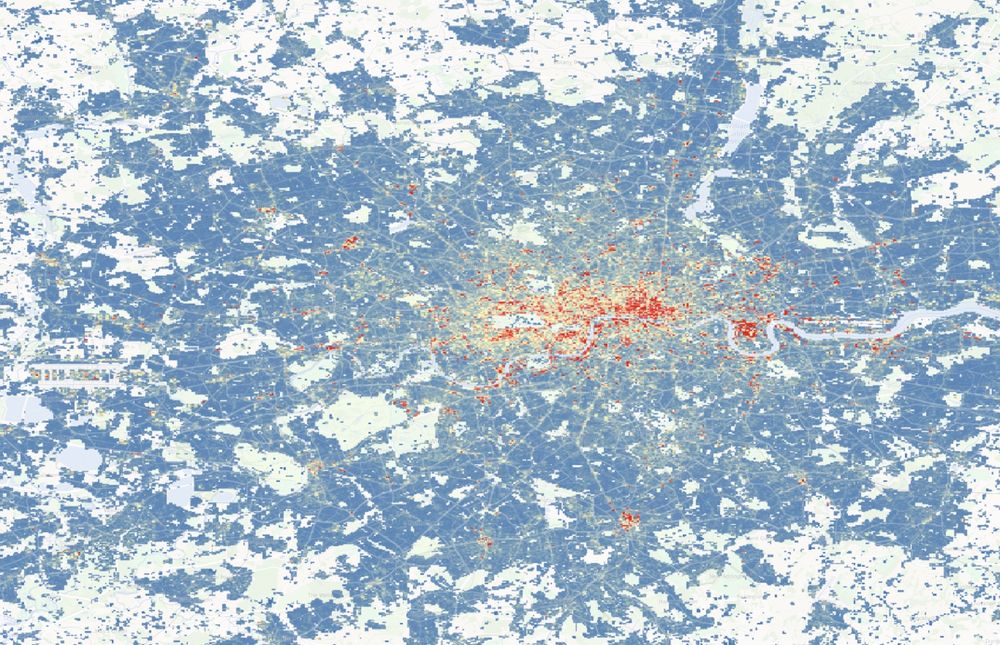
Heat map of building heights, mapped for London
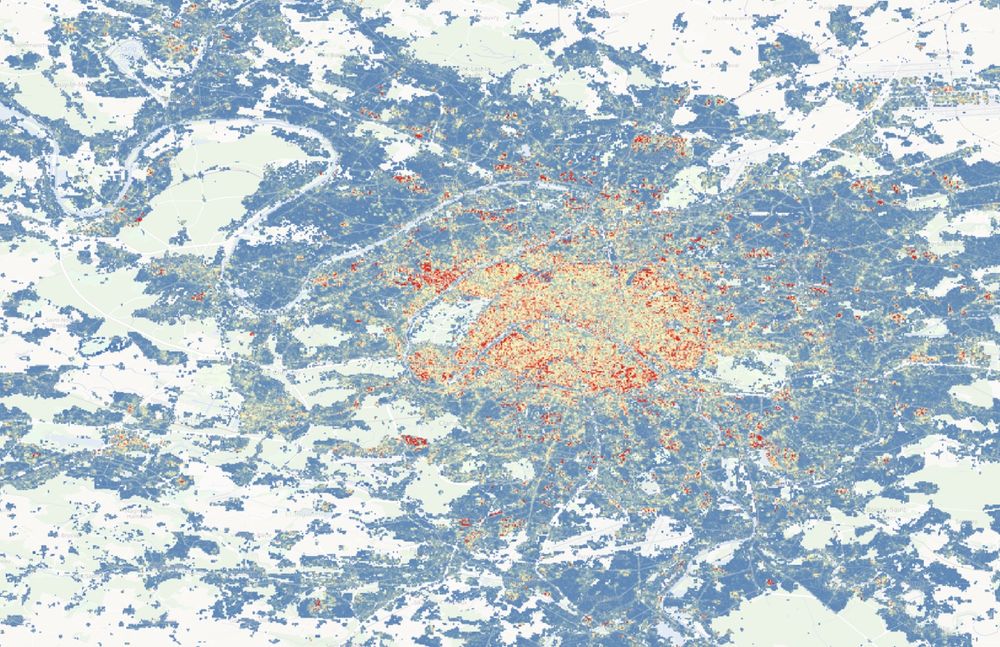
Heat map of building heights, mapped for Paris
A dataset I really like is the WSF dataset on building area and heights. Here is the *height* data for London vs. Paris, normalized at the same scale. I think it's suggestive that Parisian suburbs are more willing to develop taller on scarce urban land.
geoservice.dlr.de/web/maps/eoc...
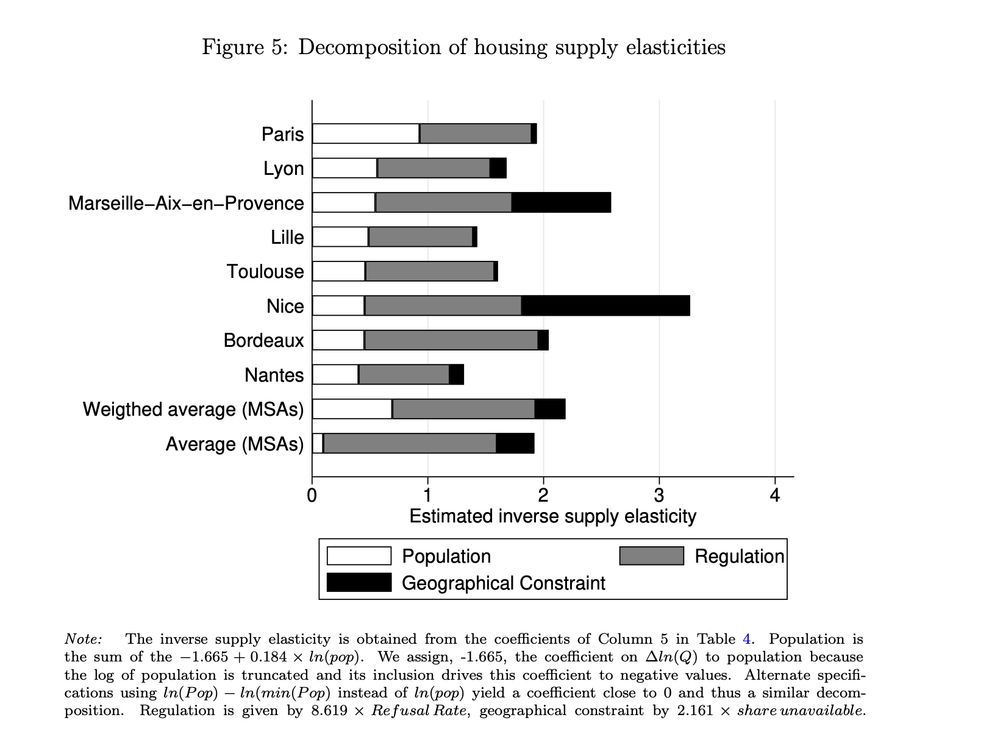
Part of what's going on here is that these aren't elasticities estimated separately for each city, but implied elasticities coming out of a cross-metro regression.
Takeaway is still clear though - Paris is a little more housing elastic than avg, driven by having more "regulatory flexibility"
There is more room to validate our dataset, as well as think through the interaction of minimum lot sizes' effects with neighborhood demand and the housing cycle.
But it makes sense to share what we have now; any comments or thoughts about the data are appreciated.
And even cities with both large lot and small lot zones do not seem to have more racially diverse residents in their small lot zones.
Possible explanation: as long as a local govt had a large MLS district somewhere, the local govt is more willing to broadly exclude development.
(2) We find less clear effects for what should be the poster children of exclusionary zoning: min. lot sizes of near a quarter-acre or above.
Why? Many of them, according to our data, were set in areas where market-supplied density is similar to the minimum.
Two results are worth previewing in this thread:
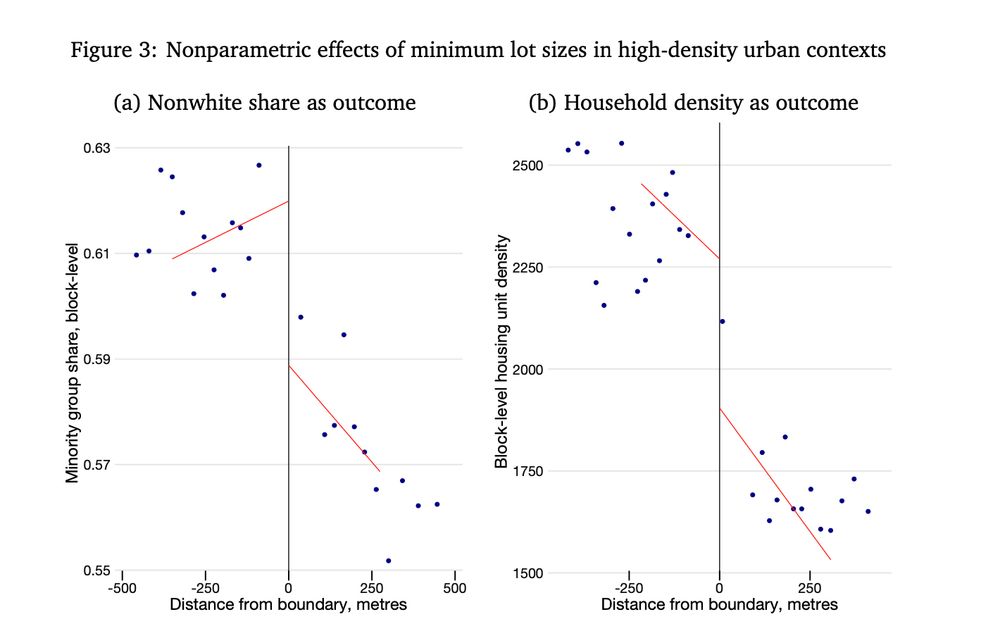
(1) Small minimum lot sizes (less than 6K sq. ft.) cause areas to have less racial change! They have limited the spread of denser homes; as a result, there are 3 to 7 pp fewer racial minority residents in the small MLS blocks.
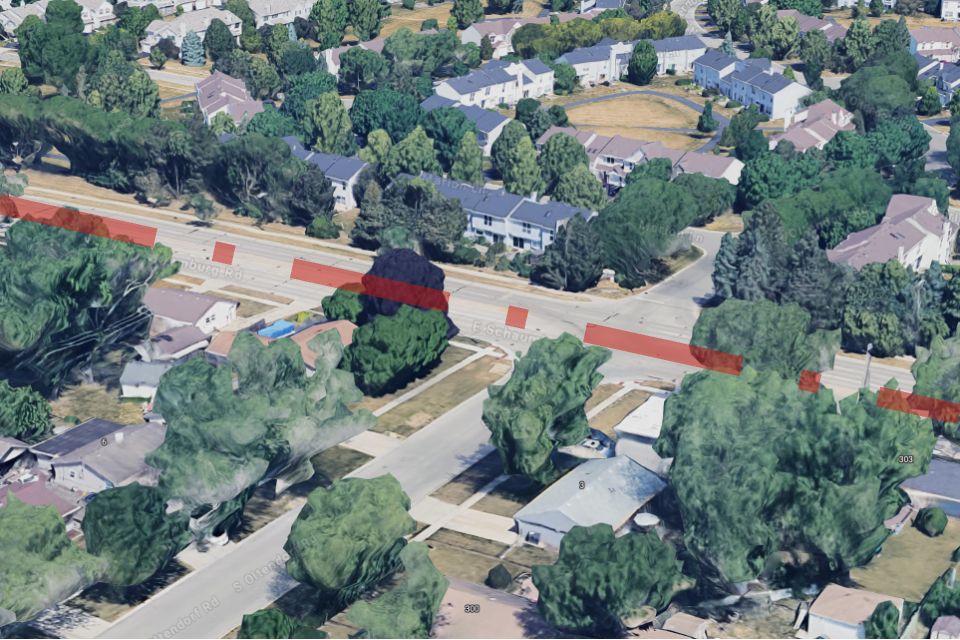
Collecting these border segments together lets us use a cleaner border discontinuity design, but also lets us identify a more policy relevant effect:
*Context-specific effects,* or "how do regulations' causal effects vary based on their marginal distortions to surrounding market-supplied density?"
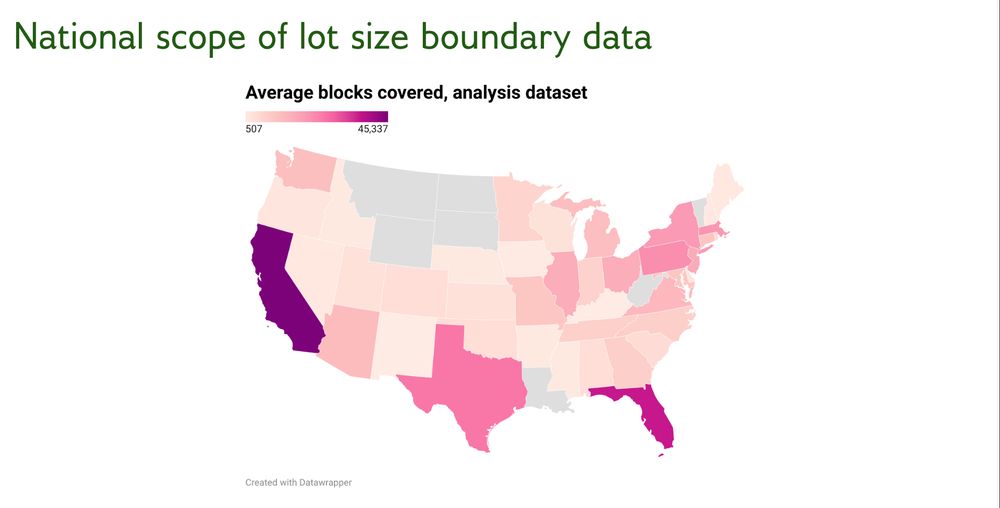
What do we get as a result? An inferred set of borders where we believe zoning districts change *within cities.*
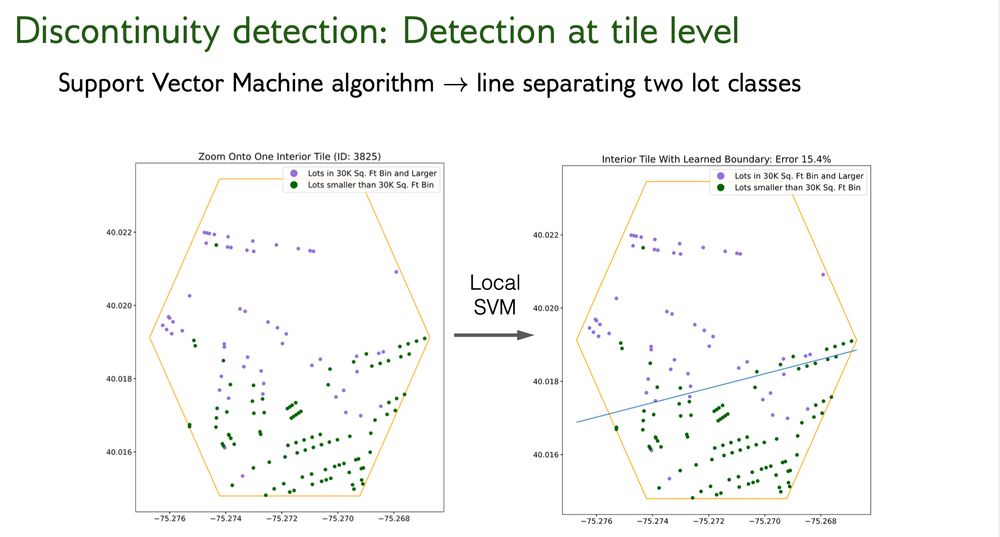
But instead of retrieving entire borders, we can filter on their "straightest" segments, which are least likely to be drawn to protect high-value land or development.
We attack this problem by first providing new data. With a scalable procedure, drawing on my previous work detecting minimum lot sizes causing "bunching at lot sizes," we
1) Geolocate developments built at those sizes, and
2) the borders where they give way to dense development
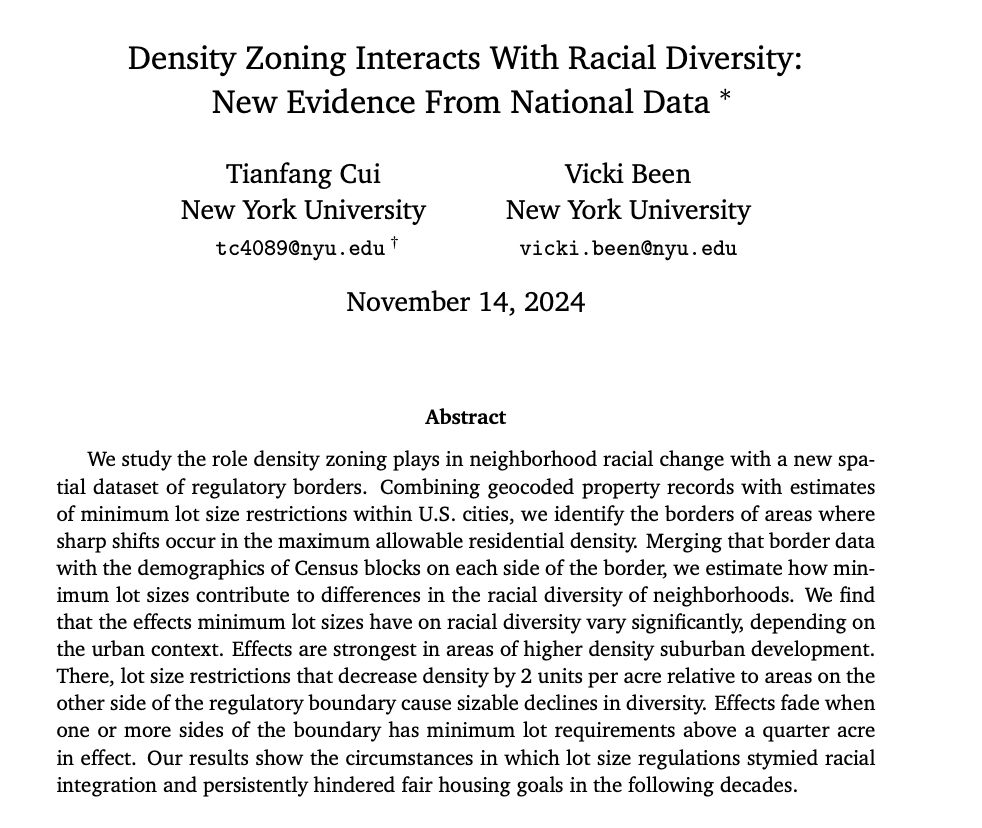
I break this down, in collaboration with Vicki Been at NYU Law/Furman.
I hadn't wanted to be brash about this, but I'm also back on the job market this year. I'm excited to talk about this new paper and my research agenda!
www.tom-cui.com/assets/pdfs/...
Which zoning regulations shaped America's urban geography the most? It's easy to paint one culprit - density zoning limiting smaller homes - in broad strokes.
Yet facts that pinpoint specific regs' role is hard to come by, even if those matter for legal and policy decisions. In a new paper...

Discussion around complicated building codes, which makes it hard to scale parts in a building for prefabrication. One reply remarks "Plus states love to fuss with the rules on handrails. I think TX modifies for a larger handrail to wall gap. MA has longer extension requirements, etc."
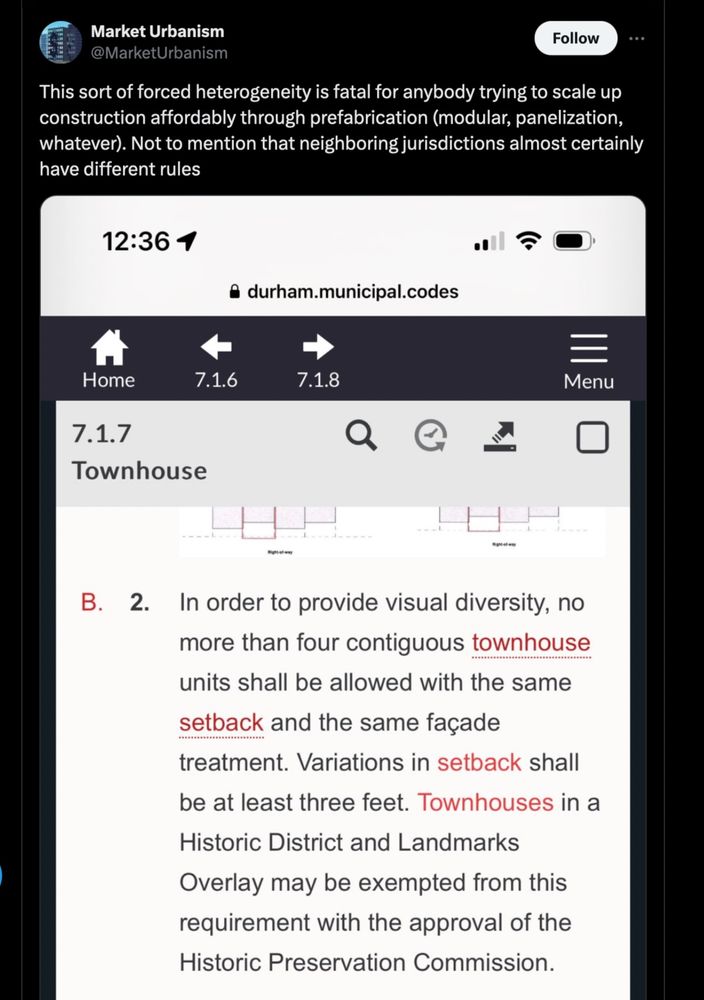
I was dying to read about what exactly was the "labyrinth of regulatory hurdles" around modular, to no avail. But they have a site and we can also cite the master
www.modular.org/building-cod...
To be closer to community members, this rent effect may be really spatially concentrated - leading to distributional conflict between newcomers and lower-middle class incumbents.
This is something I cooked up in less than an hour, so happy to discuss this further.

Why should we care about these facts? I care because it goes back to a proper literature on if rents go up after cities receive immigration flows. And the effect appears to be positive and meaningful.
But if immigrants move at a steady clip into specific neighborhoods
www.cato.org/blog/jd-vanc...