How to Detect Time Series Anomalies in R | Anomalize Package Tutorial!
#Rstats

@johaniefournier.bsky.social
Turning Agricultural Data into Insights | R Programming Educator & Ag Data Analyst Expert 🌍📊 with #Rstat | Advocate for Sustainable Agriculture 🌱 https://johaniefournieragr.link/
How to Detect Time Series Anomalies in R | Anomalize Package Tutorial!
#Rstats

In my latest post, I explore 30 years of precipitation data and apply machine learning to forecast the next decade comparing:
🔹 Random Forest
🔹 XGBoost
🔹 MARS
Read the full analysis & access the code here 👉 buff.ly/3WE1i6V
#RStats
TyT2025W19: Seismic Events at Mount Vesuvius
Is there a way to not accumulate the data but instead removing the data point each time the year changes?
code: buff.ly/5AXCcW8
#tydytuesday #Rstats
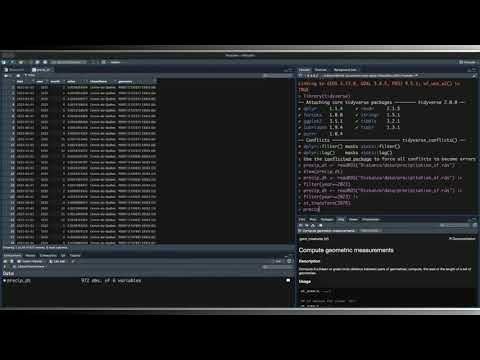
How to Compute a Distance Matrix in R | Quick Tutorial!
08.05.2025 13:19 — 👍 1 🔁 1 💬 0 📌 0
Kriging Made Easy with KrigR's kriging Function in R!
09.04.2025 16:04 — 👍 1 🔁 0 💬 0 📌 0Why is there a tiny dinosaur jumping around instead of my video thumbnail? 🤨 Ah, the beauty of automation, I suppose! 🤣 Don’t get me wrong, I don’t teach anything about dinosaurs!
26.03.2025 22:02 — 👍 0 🔁 0 💬 0 📌 0I've seen some posts questioning the future of #rstats in the age of #GenAI, especially as #LLMs are trained on more popular languages like Python and JavaScript.
I'm seeing the opposite in my own work.
Here are a couple examples:

Essentials of Geospatial Data for Agriculture in R!
#RStats
La neige joue au yo-yo cette semaine, où est-ce que je passe ma commande pour en avoir dimanche?
25.03.2025 16:50 — 👍 0 🔁 0 💬 0 📌 0I'm curious — what do you think is the most effective way to visualize spatio-temporal data?
1) Panel of small multiples
2) Animated map
3) Heat maps
4) Interactive map with a window slider
Let me know in the comments if you want examples of each!
#Rstats
I've found the use of #LLMs most effective when they augment, not replace, existing workflows.
Shown here: a proof-of-concept #rstats / Shiny app where an LLM is used to "explain" a geocoded location on a map.

High Resolution Climate Data Download Tutorial using {KrigR}!
20.03.2025 16:01 — 👍 2 🔁 0 💬 0 📌 0Side by side interactive map with {leaflet} and {leaflet.extras2}!
Code here: buff.ly/439lyBG
#RStats
Need help with that? Drop your question in the comments or DM me!

NDVI Case Study!
13.03.2025 16:00 — 👍 1 🔁 0 💬 0 📌 0Got questions or thoughts about this topic? Drop them in the comments below! I’d love to hear from you and help out however I can!
12.03.2025 16:00 — 👍 0 🔁 0 💬 0 📌 0
Analyzed 20 years of temperature trends in Chaudières-Appalaches using R packages:
✅ {pollen} to assess Growing Degree Days (GDD)
✅ {vegeperiod} for the vegetation period changes
Read the full analysis here: 🔗 buff.ly/4gIfClY
#RStats
Got questions or thoughts about this topic? Drop them in the comments below! I’d love to hear from you and help out however I can!
11.03.2025 16:00 — 👍 0 🔁 0 💬 0 📌 0
I created a heat map with {ggplot2} to visualise spatio-temporal data evolution.
#RStats
Got questions or thoughts about this topic? Drop them in the comments below! I’d love to hear from you and help out however I can!
26.02.2025 17:00 — 👍 0 🔁 0 💬 0 📌 0
Just published a deep dive into using XGBoost for predicting precipitation in Centre-du-Québec!
#Rstats
Check it out: https://buff.ly/40AbzSV
Animated visualization inspired by the amazing tutorials of Milos Popovic, PhD.
code here: https://buff.ly/3WZV5m5
#Rstats
Les érables commencent à cerner! 🎉🍁
22.02.2025 22:35 — 👍 0 🔁 0 💬 0 📌 0
Did it really rain more over the past 30 years in Centre-du-Québec?
I dug into the data to spot trends, patterns, and surprises because sometimes, what we think we know about the weather isn’t quite what the data says!
Check out my analysis and let me know →https://buff.ly/40E6skI
#RStats
I’m not sure why we need a bar chart to understand the colour, but maybe a 3D map would emphasis the darker colour.
18.02.2025 23:20 — 👍 0 🔁 0 💬 1 📌 0
Screenshot of a Quarto image gallery page
I put together a little #quartopub extension to automatically create image galleries for Quarto websites: vuorre.com/quarto-galle...
18.02.2025 21:20 — 👍 8 🔁 1 💬 2 📌 0Really interesting!
17.02.2025 19:26 — 👍 1 🔁 0 💬 0 📌 0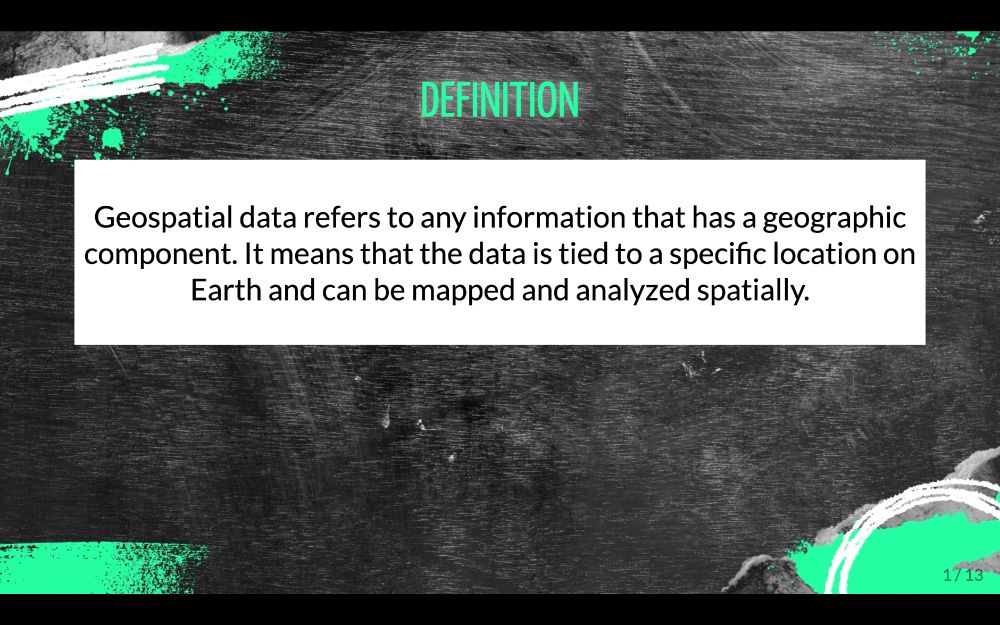
not me playing with dark, bold, fluo theme for a presentation now that I'm not in corporate anymore...🤠
#rstats

I just created a tiny tutorial on {rgeoboundaries}.
How do you find the auto zoom? I'm not sure if I like it or if it's making me dizzy.
#rstats
youtu.be/K5khtyIdnbk
Thanks!
12.02.2025 21:46 — 👍 0 🔁 0 💬 0 📌 0