Paleoclimate pattern effects help constrain climate sensitivity and 21st-century warming | PNAS
Paleoclimates provide examples of past climate change that inform estimates of modern
warming from greenhouse-gas emissions, known as Earth’s clima...
Really excited to see this paper out!! Led by @vtcoop.bsky.social we show that if you use cold and warm paleoclimates together, you can reduce uncertainty in Earth's climate sensitivity by quantifying the pattern effect and more precisely constrain future climate change www.pnas.org/doi/10.1073/...
23.01.2026 15:36 —
👍 104
🔁 45
💬 1
📌 2

Seasonal cycle of global mean daily sea surface temperatures from https://climatereanalyzer.org/clim/sst_daily/?dm_id=world2
🌊📉 Sea surface temperatures have… come back down.
After the big global jump in 2023/24, SSTs are now back at below pre-jump levels in November (climatereanalyzer.org/clim/sst_dai...).
Climate surprise or expected? What role does climate variability play? Let’s try to unpack 👇
15.12.2025 10:40 —
👍 18
🔁 6
💬 1
📌 3

To collapse or not: the stability of the AMOC in a warming climate — NERC GW4+
Supervisor: Dr Rory Bingham Project keywords: climate, oceanography, AMOC, sea-level, AI
📢 PhD opportunity! 🌊
“To collapse or not: the stability of the AMOC in a warming climate”
Deadline: 8 Jan 2026
Work with Bristol, Liverpool & the Met Office on AMOC stability using observations, models & AI.
Details: www.nercgw4plus.ac.uk/projects-202...
Please share with anyone interested!
04.12.2025 18:58 —
👍 5
🔁 6
💬 0
📌 0

Causal mechanisms of subpolar gyre variability in CMIP6 models
Abstract. The subpolar gyre is at risk of crossing a tipping point under future climate change associated with the collapse of deep convection. As such, tipping can have significant climate impacts; i...
📢 New paper out!
🌊 We discuss how well mechanisms of variability in the subpolar gyre are represented in climate models, finding that models that do this best are also the models in which abrupt shifts are found 😬.
It's a technical story, so here's a simple overview 🧵
doi.org/10.5194/esd-...
28.10.2025 12:26 —
👍 82
🔁 36
💬 2
📌 4
🚨PERMANENT POSITION OPENING🚨
A lecturer position is opening at LOCEAN on the topic: ‘Impact of climate change on marine ecosystems in the Southern Ocean’ (permanent position with the French Natural History Museum, for a researcher that will be based at LOCEAN, in the centre of Paris).
16.10.2025 12:52 —
👍 4
🔁 10
💬 1
📌 0
Thanks for your interest and I'm glad you liked this part. I'm certainly no expert on these instrument uncertainties, but for our purposes they ended up being negligible relative to the scales of interest (i.e., model bias and inter-model spread in sea ice extent).
08.10.2025 18:00 —
👍 0
🔁 0
💬 0
📌 0
By linking Antarctic sea ice, cloud cover, deep ocean temperatures, and global warming, our new study led by @linusvogt.bsky.social finds that ocean heat uptake and thermal sea level rise by 2100 could be 3–14% higher, and global surface warming 3–7% greater than previously thought👇
02.10.2025 12:36 —
👍 19
🔁 8
💬 0
📌 0
That sounds really interesting, let me know when there is a preprint!
Funnily enough, using HadISST in our study would also have led to an exaggerated "conservative" estimate of high warming, since then the models would underestimate Antarctic SIE even more. But fortunately we are not sailors.
02.10.2025 20:21 —
👍 0
🔁 0
💬 0
📌 0
Thanks for the clarification!
02.10.2025 18:25 —
👍 0
🔁 0
💬 1
📌 0
Special thanks to @polarocean.bsky.social who had the initial idea for this project, and to all coauthors: @jbsallee.bsky.social, Casimir de Lavergne, @froeltho.bsky.social, and Lester Kwiatkowski.
02.10.2025 10:48 —
👍 6
🔁 0
💬 0
📌 0

Two box plots showing the distribution of future global heat uptake with and without an observational constraint. The constrained estimate is larger and less uncertain than the prior.
📈 As CMIP6 models underestimate historical Antarctic sea ice extent on average, this leads to an upward correction of climate projections by 2100 under all considered scenarios:
- OHU +3–14%
- Cloud feedback +19–32%
- Global surface warming +6–7%
02.10.2025 10:48 —
👍 7
🔁 0
💬 1
📌 1

A scatter plot showing the relationship between historical Antarctic sea ice extent (x-axis) and future ocean heat uptake (y-axis) across an ensemble of 28 climate models. There is a positive correlation of r=0.87. Also indicated is the observed value of Antarctic sea ice extent, showing that models tend to underestimate it.
Thus, the state of Antarctic sea ice today quantifies the potential for global climate change in the future.
More sea ice now → more warming later
This is evident as a strong correlation across CMIP6 models (and it also holds in CMIP5)
02.10.2025 10:48 —
👍 7
🔁 0
💬 1
📌 0

Part of a schematic from a paper showing a transition from an initial climate state to a future climate state under 21st century climate change. In climate models with a cold initial state, the transition is larger than in models with a mild initial state. The "coldness" of the initial state is quantified using Antarctic sea ice extent.
The constraint is based on Antarctic sea ice extent 🧊
Models with more sea ice today also simulate colder Southern Ocean SSTs, a colder deep ocean, and more mid-latitude cloud cover.
In the future, these models lose more sea ice and clouds, amplifying SW cloud feedback, surface warming, and OHU.
02.10.2025 10:48 —
👍 7
🔁 0
💬 1
📌 1
I had an engagement with blogger, failed California gubernatorial candidate, and self-identified reporter Michael Shellenberger this past week, which started out being about this new paper being heralded by climate skeptics as disproving global sea-level acceleration. (LONG 🧵)
05.09.2025 18:05 —
👍 188
🔁 72
💬 4
📌 26
Portail Emploi CNRS - Offre d'emploi - Postdoctoral researcher in polar climate modeling (M/F)
🌊
Looking for a #postdoc to join us at @ipsl.bsky.social within the #ANR project #AIAI (AI to improve coupling between the Antarctic 🧊 and the 🌊/🌧️), a collaboration between @igegrenoble.bsky.social , @lsce-ipsl.bsky.social and #LOCEAN!
Deadline: Aug 8th
Apply here: emploi.cnrs.fr/Offres/CDD/U...
23.07.2025 08:40 —
👍 7
🔁 5
💬 2
📌 2
Paper just out in AI4Earth led by the incredible @eveapiedagnel.bsky.social. We show how to exploit the ocean’s tight T-S relationship at constant pressure to map trends in salinity from sparse data doi.org/10.1175/AIES.... GMM works well because the relationships are so linear, but why are they?
23.07.2025 02:20 —
👍 5
🔁 1
💬 0
📌 0

Will anyone review this paper? Screening, sorting, and the feedback cycles that imperil peer review
Scholarly publishing relies on peer review to identify the best science. Yet finding willing and qualified reviewers to evaluate manuscripts has become an increasingly challenging task, possibly even ...
1. Kevin Gross and I just posted a new science-of-science preprint.
This one explores the looming peer review crisis. As many of you know, it's becoming significantly more difficult for journal editors to find scholars willing to serve as peer reviewers for submitted manuscripts.
16.07.2025 03:13 —
👍 563
🔁 224
💬 22
📌 21
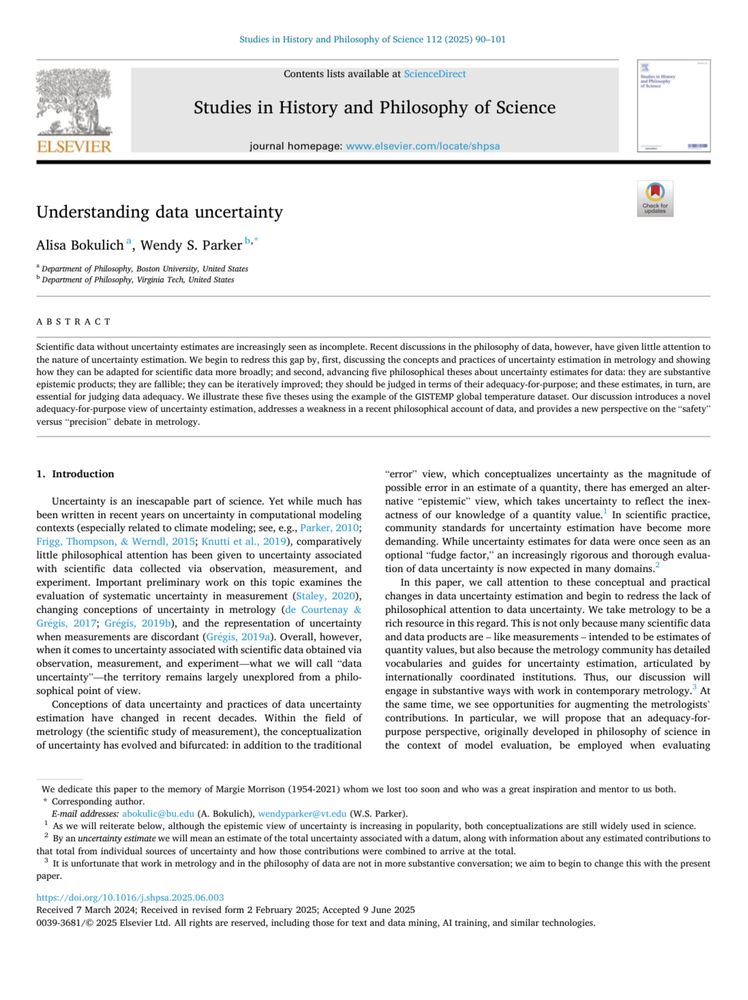
Studies in History and Philosophy of Science
journal homepage: www.elsevier.com/locate/shpsa
Understanding data uncertainty
Alisa Bokulich", Wendy S. Parker b,"
" Department of Philosophy, Boston University, United States
› Department of Philosophy, Virginia Tech, United States
ABSTRACT
Scientific data without uncertainty estimates are increasingly seen as incomplete. Recent discussions in the philosophy of data, however, have given little attention to the nature of uncertainty estimation. We begin to redress this gap by, first, discussing the concepts and practices of uncertainty estimation in metrology and showing how they can be adapted for scientific data more broadly; and second, advancing five philosophical theses about uncertainty estimates for data: they are substantive
adequacy-for-purpose view of uncertainty estimation, addresses a weakness in a recent philosophical account of data, and provides a new perspective on the "safety" versus "precision" debate in metrology.
1. Introduction
Uncertainty is an inescapable part of science. Yet while much has been written in recent years on uncertainty in computational modeling contexts (especially related to climate modeling; see, e.g., Parker, 2010;
Frigg, Thompson, & Werndl, 2015; Knutti et al., 2019), comparatively little philosophical attention has been given to uncertainty associated with scientific data collected via observation, measurement, and experiment. Important preliminary work on this topic examines the evaluation of systematic uncertainty in measurement (Staley, 2020), changing conceptions of uncertainty in metrology (de Courtenay & Grégis, 2017; Grégis, 2019b), and the representation of uncertainty when measurements are discordant (Grégis, 2019a). Overall, however, when it comes to uncertainty associated with scientific data obtained via observation, measurement, and experiment—what we will call "data uncertainty"-the territory remains largely unexplored from a philosophical point of view.
Conception…
⏰ Free access to read & download thru August 20 the final published version of Wendy Parker & my paper "Understanding Data Uncertainty" at this link ⬇️
authors.elsevier.com/c/1lMUI8yuR6...
#philsci #metasci 🧪 ⚒️
01.07.2025 21:39 —
👍 82
🔁 24
💬 1
📌 2

Influence of Wave‐Induced Variability on Ocean Carbon Uptake
Wave effects introduce high-frequency variability and amplify the air-sea CO2 flux seasonality, with the largest impacts during storms Wave effects enhance carbon storage and amplify hemispheric ...
Do bubbles matter for ocean carbon uptake? 🌊🫧
Yes, especially for local CO2 fluxes, where wave breaking can enhance variability by up to 40%. That’s an important consideration for #mCDR, where fluxes could otherwise be miscalculated. More in our paper here: [https://doi.org/10.1029/2024GB008382]
25.06.2025 02:28 —
👍 27
🔁 6
💬 1
📌 1
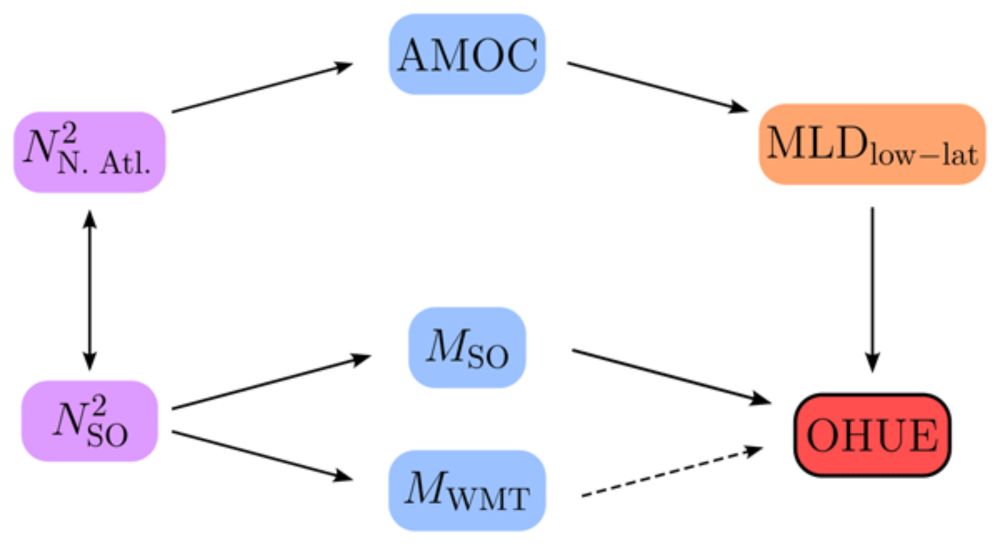
Check out the full paper for a detailed analysis of all the inter-model links between stratification patterns, overturning, MLD, and OHUE.
Huge thanks to my (now former 🥲) PhD advisors, @jbsallee.bsky.social and Casimir de Lavergne!
23.06.2025 13:35 —
👍 1
🔁 0
💬 0
📌 0
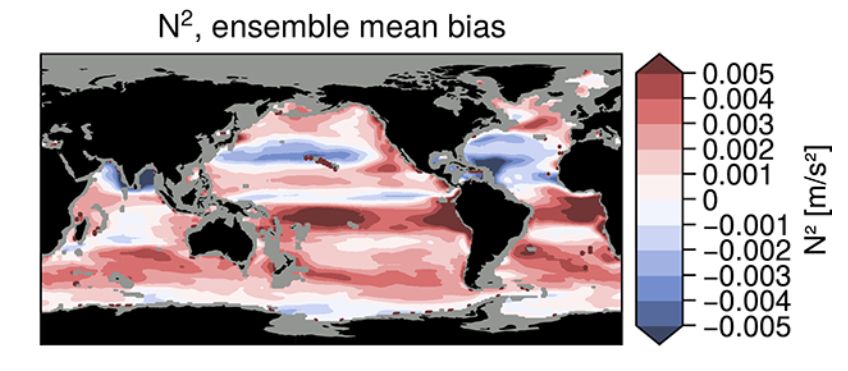
A map showing the difference in historical upper-ocean stratification between the CMIP6 ensemble mean and observations (ECCO state estimate). The models have a more strongly stratified upper ocean in the Tropics, midlatitude Southern Ocean, and subpolar North Atlantic.
We further find that the previously assumed importance of the AMOC for OHU efficiency can be explained by an inter-hemispheric connection in stratification strength between these two regions.
As CMIP6 models are too stratified in precisely these regions on average, they tend to underestimate OHUE.
23.06.2025 13:35 —
👍 0
🔁 0
💬 1
📌 0
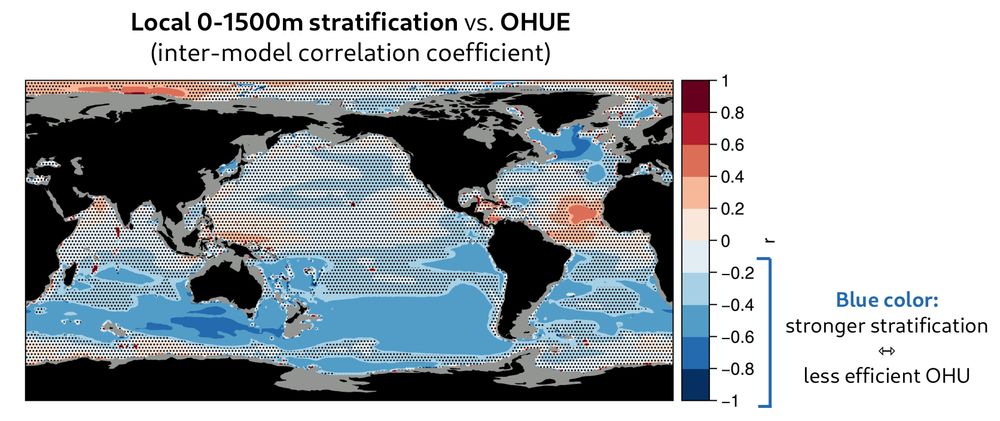
A map showing the inter-model correlation coefficient between local upper ocean stratification and OHUE. In the mid-latitude Southern Ocean and the subpolar North Atlantic, stronger stratification is associated with lower OHUE across models.
We show that upper-ocean stratification inhibits OHU efficiency in the Southern Ocean and the subpolar North Atlantic.
This is because stratification in these regions is linked to large overturning cells: the Southern Ocean upper cell and the AMOC.
23.06.2025 13:35 —
👍 0
🔁 0
💬 1
📌 0
So which oceanic parameters are responsible for setting the value of the OHU efficiency?
Many answers have been previously proposed, including AMOC strength, mixed layer depths, and stratification.
In our paper, we use an ensemble of CMIP6 models to disentangle this issue.
23.06.2025 13:35 —
👍 0
🔁 0
💬 1
📌 0
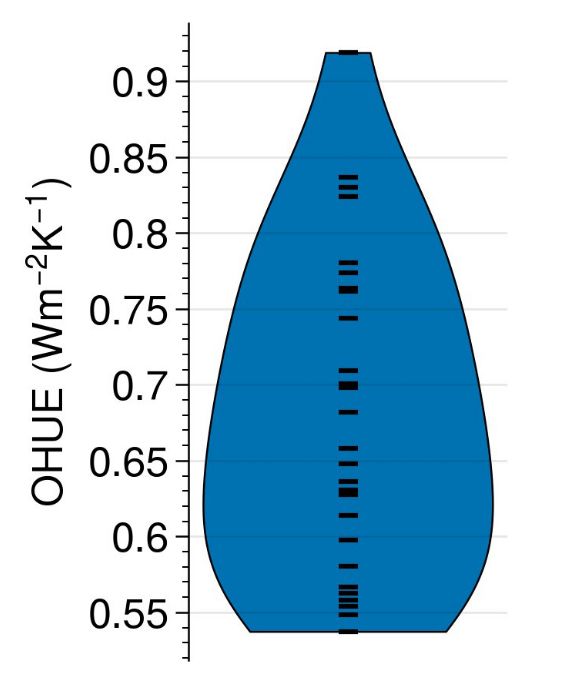
A violin plot showing the distribution of ocean heat uptake efficiency (OHUE) across 28 CMIP6 models. The OHUE values span a range of approx. 0.5 -- 1 W/m²K
In observations, the OHU efficiency in recent decades was around 0.6 W/m² per °C of global warming (Cael 2022, doi.org/10.1029/2022...).
However, current-generation climate models simulate a large range of values for this quantity, almost spanning a factor of 2:
23.06.2025 13:35 —
👍 1
🔁 0
💬 1
📌 0
The ocean buffers climate change by removing heat from the atmosphere and storing it at depth.
This effect can be quantified by the "ocean heat uptake efficiency", the amount of heat uptake per degree of global warming.
OHU efficiency = OHU / ΔT
23.06.2025 13:35 —
👍 0
🔁 0
💬 1
📌 0

Photo of the a large group of GISS employees/colleagues in front of Toms Restaurant with a prominent street sign saying "112th St" taken from the middle of Broadway. Credit: Tricia Baron.
Last day at the GISS building (Wed. May 28th). 🥲
31.05.2025 13:51 —
👍 725
🔁 150
💬 50
📌 44