Holy shit wait for it
10.07.2025 07:41 — 👍 5029 🔁 1459 💬 266 📌 213
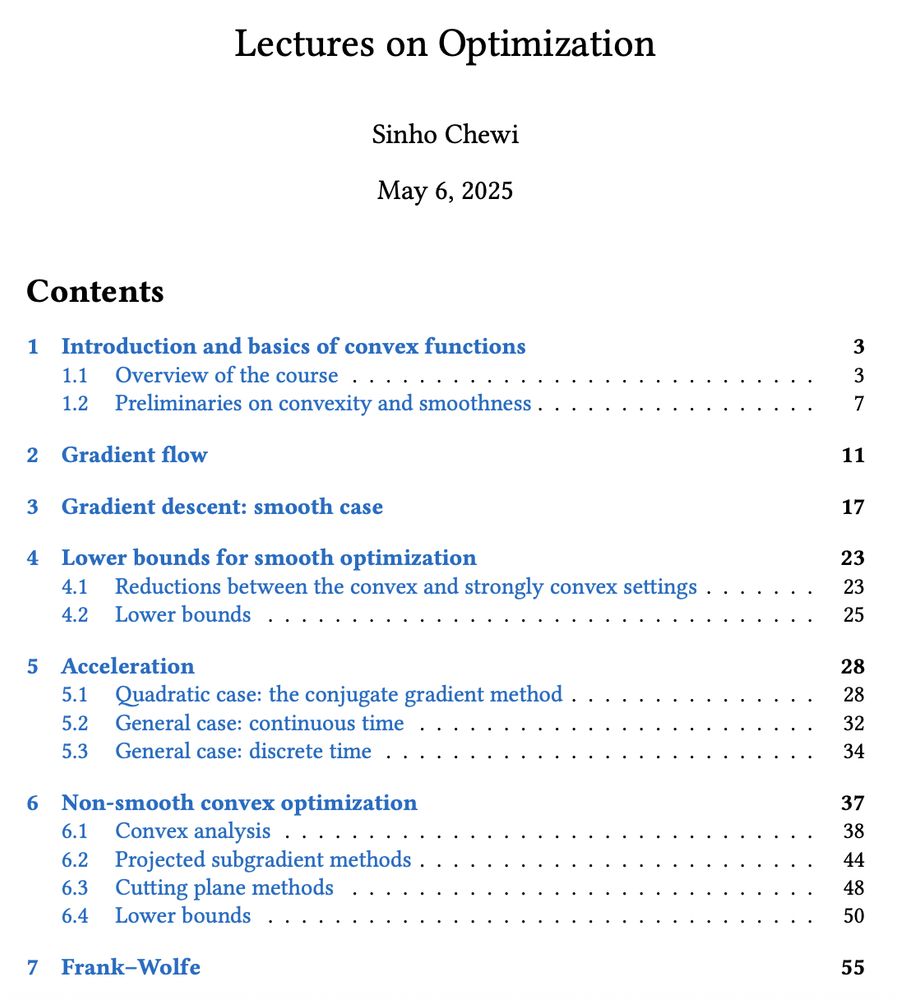
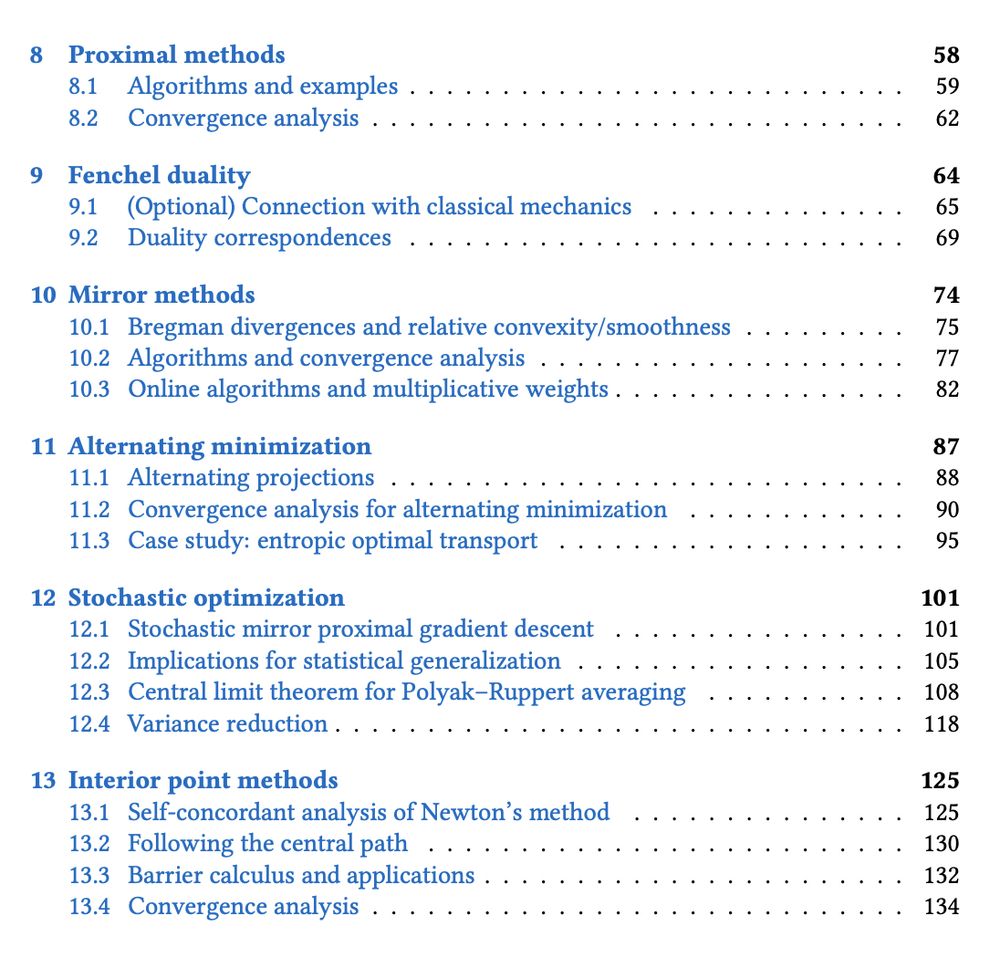
pretty sweet:
chewisinho.github.io/opt_notes_fi...
23.05.2025 15:33 — 👍 55 🔁 12 💬 2 📌 0

GitHub - wjnkim/tmo: Thresholding Multiple Outcomes (TMO) estimator for standard errors
Thresholding Multiple Outcomes (TMO) estimator for standard errors - wjnkim/tmo
The paper provides detailed guidance on selecting suitable collections of auxiliary outcomes and combining TMO with existing spatial standard errors. STATA code for implementing TMO is available here:
github.com/wjnkim/tmo
arxiv.org/abs/2504.13295
04.05.2025 02:04 — 👍 1 🔁 0 💬 0 📌 0
Applying TMO to nine recent papers, we find significant impacts on estimated standard errors, with a median increase of 37% compared to the published estimates.
04.05.2025 02:04 — 👍 1 🔁 0 💬 1 📌 0
(2) Determine a correlation threshold from these estimates; pairs exceeding this threshold are modeled as correlated.
(3) Compute standard errors by accounting only for correlations above the threshold.
04.05.2025 02:04 — 👍 1 🔁 0 💬 1 📌 0
Our proposed method, Thresholding Multiple Outcomes (TMO), has three steps:
(1) Estimate pairwise correlations across locations using multiple outcomes.
04.05.2025 02:04 — 👍 1 🔁 0 💬 1 📌 0
The main idea of this paper is to use collections of outcomes, of this form, to identify which location pairs should be allowed to correlate when constructing standard errors in regression problems.
04.05.2025 02:04 — 👍 1 🔁 0 💬 1 📌 0
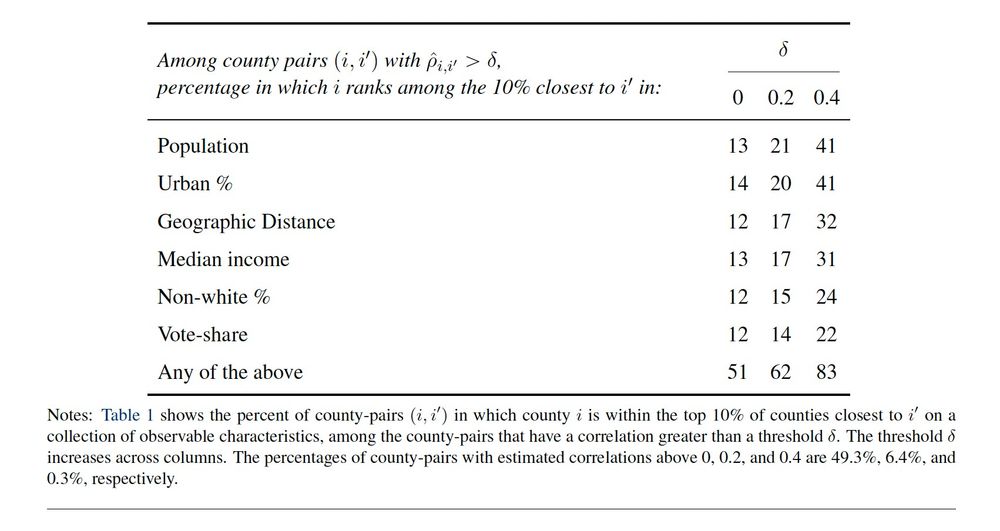
This suggests geographic proximity alone inadequately captures spatial dependence. Even adding population as a covariate doesn’t fully resolve the issue. While several covariates predict high correlations, no single factor completely captures the dependence structure.
04.05.2025 02:04 — 👍 1 🔁 0 💬 1 📌 0
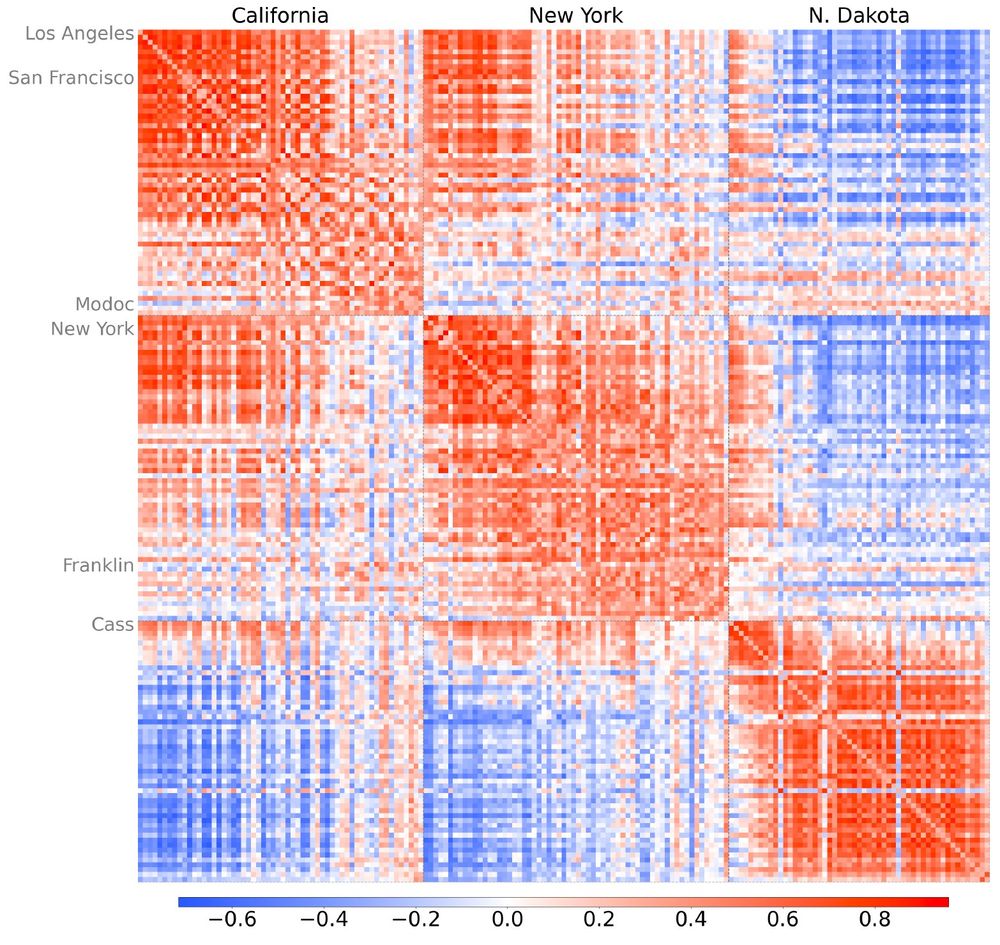
Here's a correlogram for counties in CA, NY, and ND, sorted by state and population. Urban counties in CA correlate more strongly with urban counties in NY than with rural counties in CA. Rural CA counties correlate more closely with ND counties than with urban areas within CA.
04.05.2025 02:04 — 👍 2 🔁 0 💬 1 📌 0
Are these methods appropriate for the types of dependence that we might expect for economic data? We assess this by collecting 91 U.S. county-level outcomes (unemployment, income, etc) and computing the correlation, across outcomes, between each pair of counties
04.05.2025 02:04 — 👍 0 🔁 0 💬 1 📌 0
About half of the papers in top-5 economics journals in 2023 analyze data indexed by geographic locations. Typically, these papers handle spatial dependence by clustering SEs at a higher aggregation level or by modeling dependence based on geographic distance (e.g., Conley SEs).
04.05.2025 02:04 — 👍 1 🔁 0 💬 1 📌 0
Very excited to share this new working paper, joint with @sdellavi.bsky.social, Guido Imbens, and Woojin Kim
bsky.app/profile/nber...
04.05.2025 02:04 — 👍 17 🔁 3 💬 2 📌 0
The Thresholding Multiple Outcomes method addresses spatial correlation in regressions by using information from additional outcomes to identify correlated locations, from Stefano DellaVigna, Guido Imbens, Woojin Kim, and @dritzwoller.bsky.social https://www.nber.org/papers/w33716
29.04.2025 20:00 — 👍 17 🔁 2 💬 0 📌 1
Stefano DellaVigna, Guido Imbens, Woojin Kim, David M. Ritzwoller: Using Multiple Outcomes to Adjust Standard Errors for Spatial Correlation https://arxiv.org/abs/2504.13295 https://arxiv.org/pdf/2504.13295 https://arxiv.org/html/2504.13295
21.04.2025 06:00 — 👍 0 🔁 2 💬 1 📌 0
Thanks Cameron!
31.12.2024 20:10 — 👍 1 🔁 0 💬 1 📌 0
Assistant professor (of mathematics) at the University of Toronto. Algebraic geometry, number theory, forever distracted and confused, etc. He/him.
yields falsehood when preceded by his own quotation
Mathematician at UCLA. My primary social media account is https://mathstodon.xyz/@tao . I also have a blog at https://terrytao.wordpress.com/ and a home page at https://www.math.ucla.edu/~tao/
Aspiring philosopher; tolerable human; "amusing combination of sardonic detachment & literally all the feelings felt entirely unironically all at once" [he/his]
Assistant Professor at the Department of Computer Science, University of Liverpool.
https://lutzoe.github.io/
Professor of Political Science at Stanford | Exploring money in politics, campaigns and elections, ideology, the courts, and inequality | Author of The Judicial Tug of War cup.org/2LEoMrs | https://data4democracy.substack.com
expert provider of lay opinions
Prof at @StanfordLaw.bsky.social, Senior Fellow at @SIEPR.bsky.social, physics PhD. Researching IP & innovation. Coauthor of free patent casebook: patentcasebook.org
Dad, husband, journalist at 9News Denver. Proud of Next viewers' $15M in Word of Thanks microgiving. Next with Kyle Clark 6p weeknights + 9NEWS at 9/10p on-air/streaming on 9NEWS+. Signal tips: 303-871-1841.
Basketball stats and history for the NBA, WNBA, European Leagues, ABA, and more.
The 2025-26 NBA season is almost here! American Express NBA Tip-Off begins Oct. 21 on NBC and Peacock.
The official account for the NBA
Economic Historian at the Census. 19th & 21st C innovation, sci of sci, urban/spatial, info spread. All views are my own or expressed for rhetorical exposition. Posts before 2025 were imported. (they/them)
Brookline, MA
Ex NY Times, now author of Substack Paul Krugman. Nobel laureate and, according to Donald Trump, "Deranged BUM"
Associate Professor of Economics, John Jay College, CUNY. Bass player for Light Sweet Crude and Minaxi. All thoughts my own.
Senior Staff Writer @ The Ringer
Co-Founder of Count The Dings
Proud Haitian 🇭🇹
Economist + cat dad. Opinions my own.
Personal site: https://ramattheis.github.io
Professor at Sao Paulo School of Economics - FGV
Econometrics/Applied Micro/affiliate @JPAL
MIT Econ PhD
https://sites.google.com/site/brunoferman/home
Columbia postdoc and ex-Quantco. Personal website: www.ohines.com
economist thinking about taxes and public debt | co-organizer for the virtual municipal finance workshop | ap in finance at the wharton school
www.danggarrett.com
www.muni-workshop.com